


Ecommerce sales exploded during the 2020’s pandemic.
With most people spending more time at home, online shopping became a common pastime around the world.
Ecommerce soared to new heights for both consumers and businesses as millions of people spent more time online during COVID-19.
But there is one question that everyone is asking…
These ecommerce statistics give you the complete picture of where ecommerce is right now and what we can expect for the future.
What Will I Learn?
Key Ecommerce Statistics
Before we dive into the stats, here are the key ecommerce statistics you should know:
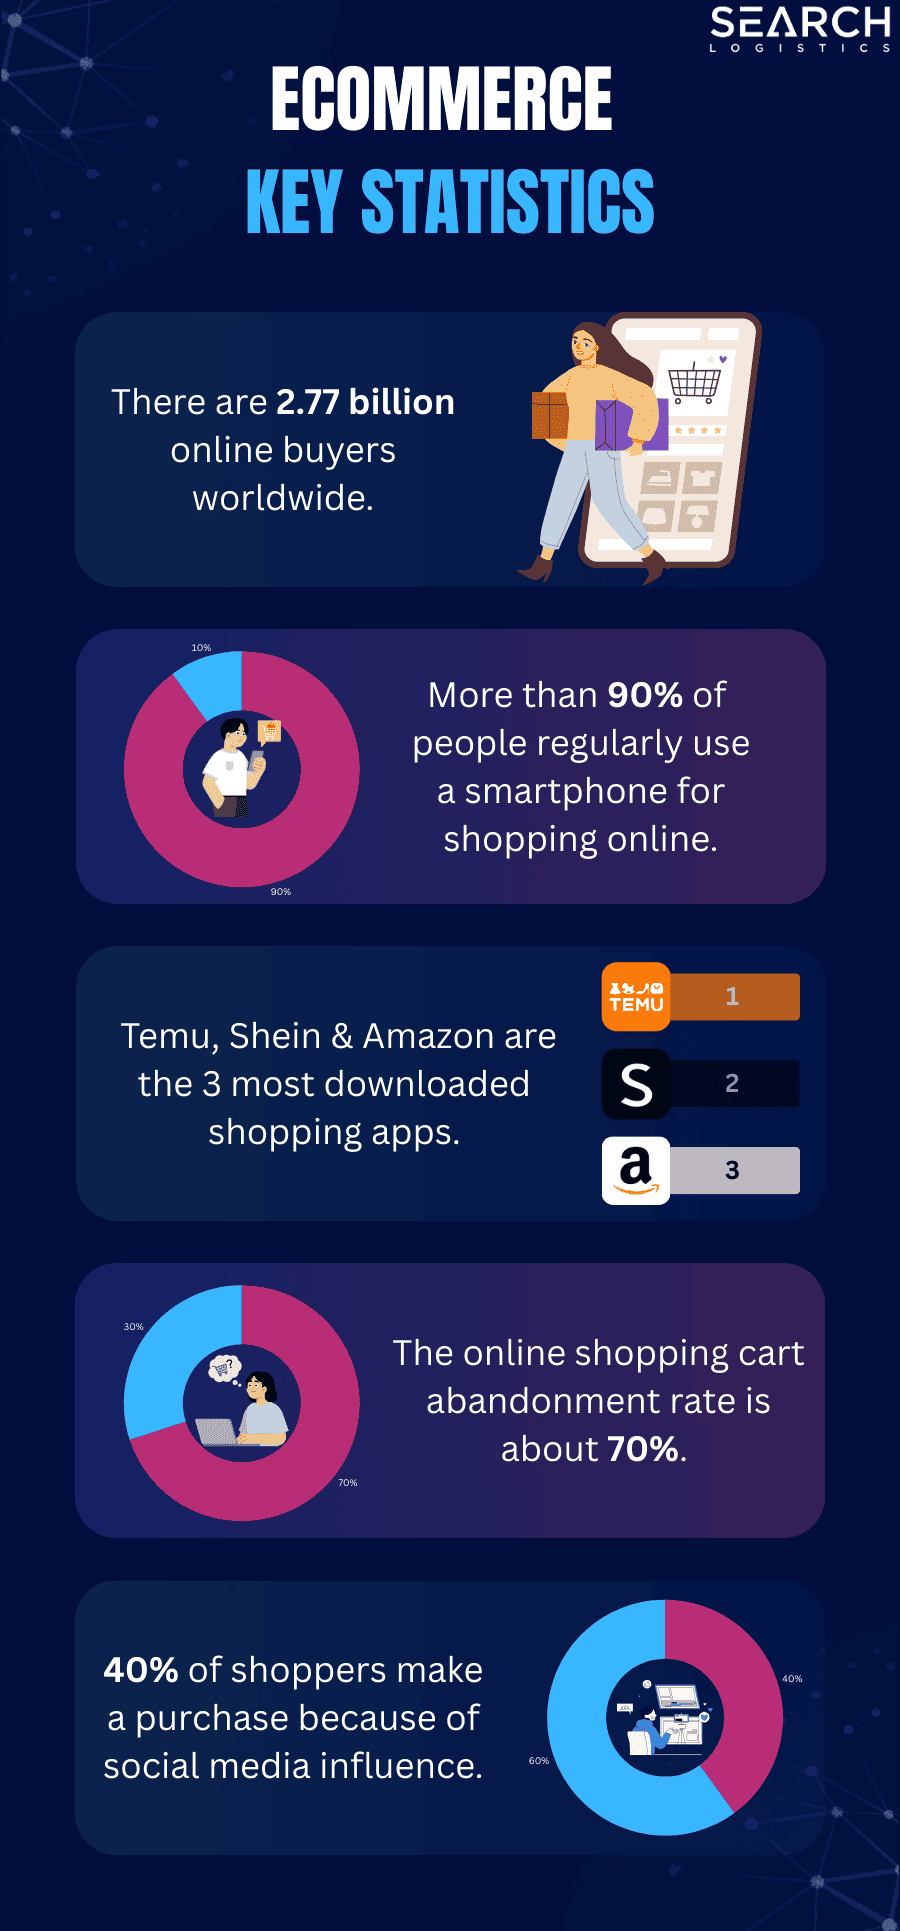
- There are 2.77 billion online buyers worldwide, accounting for over 33% of the global population.
- 93% of millennials consistently intend to buy products during Black Friday or Cyber Monday sales.
- 81.3% of millennials shop online at least once a month.
- The online shopping cart abandonment rate is about 70%.
- 34% of consummers shop online at least once a week.
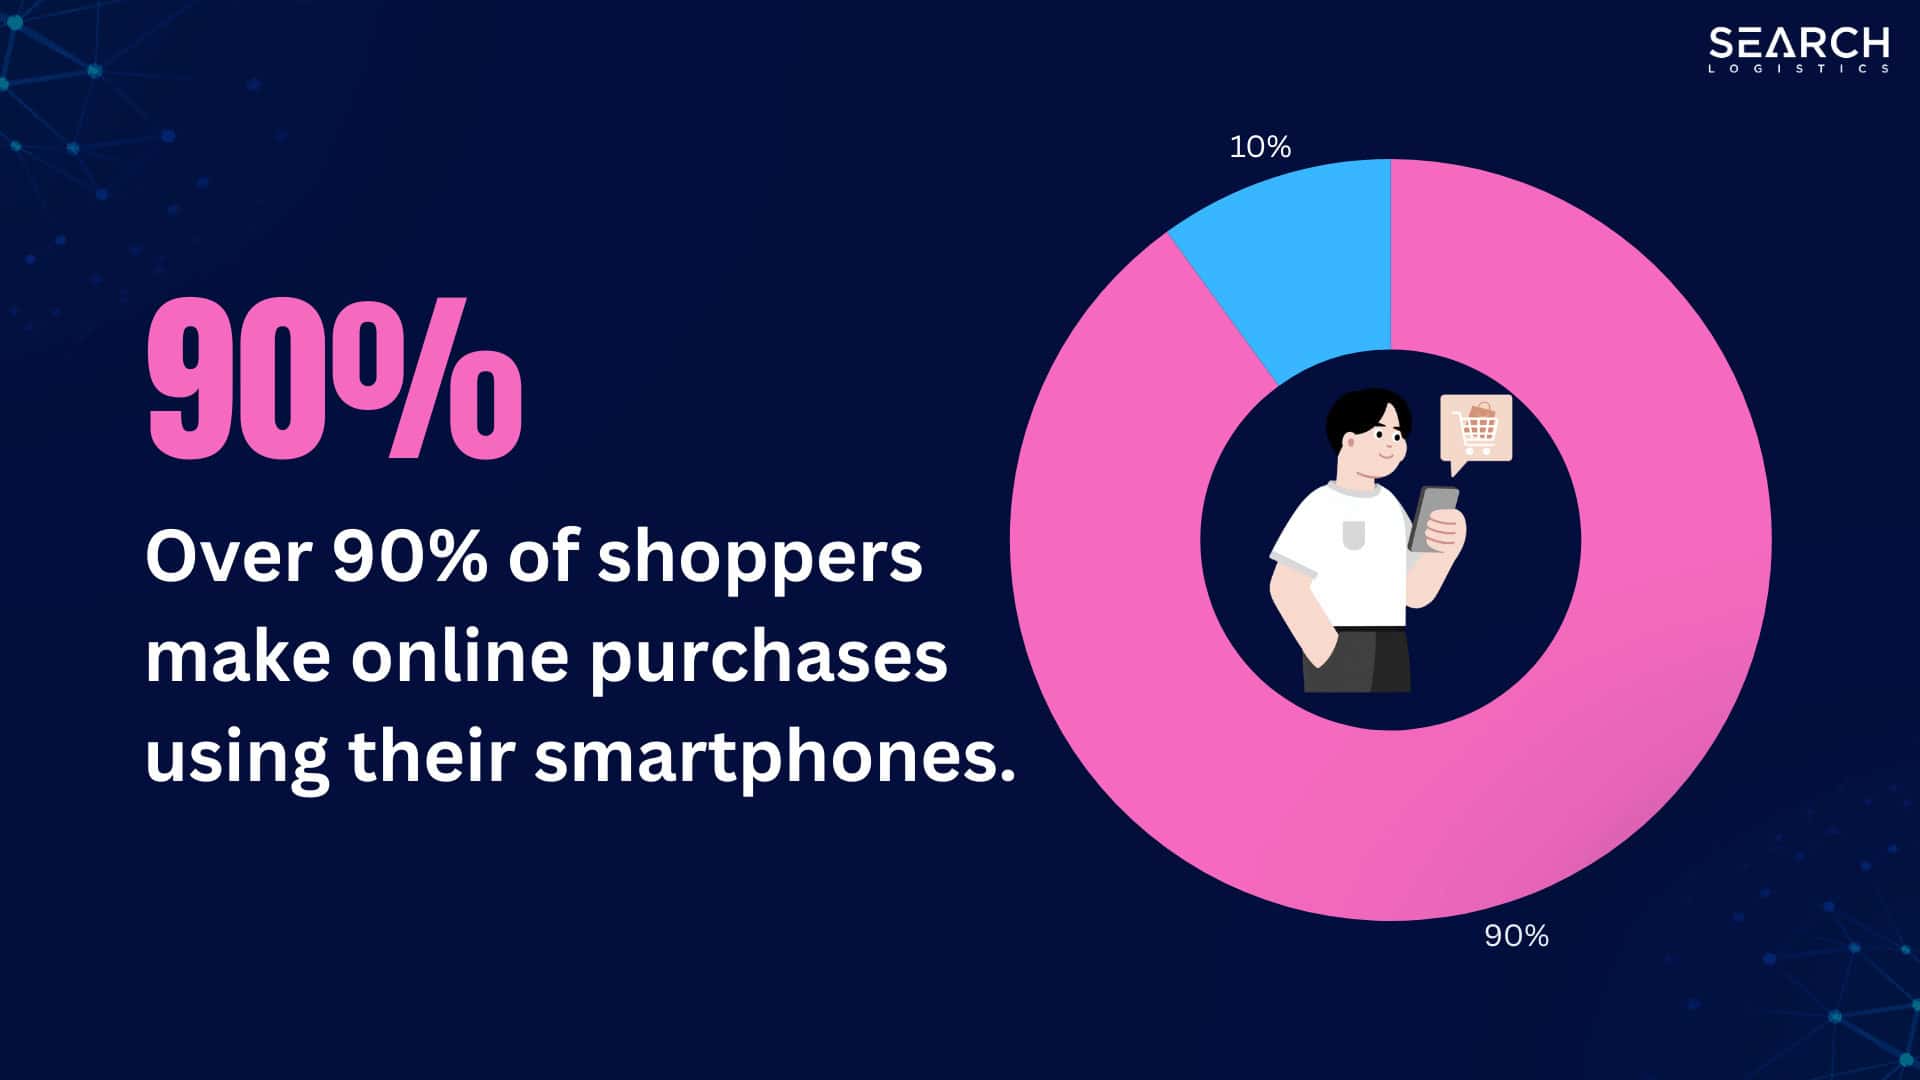
- 91% of shoppers make online purchases using their smartphone.
- Mobile commerce sales are expected to account for 62% of all retail sales by 2027.
- Asia-Pacific (countries in East Asia, Southeast Asia, South Asia, and Oceania) was the largest region for e-commerce in 2025.
- There are currently over 26 million ecommerce sites and stores worldwide
COVID-19 Ecommerce Statistics
The pandemic pushed businesses to adopt and change their ways of operating.
From creating online shops (a.k.a ecommerce stores) to opting for new payment methods, business owners had to innovate to avoid closing their businesses.
So, what’s exactly changed during the pandemic?
From Physical Shops To Online Shops
Brick-and-mortar businesses were forced to move their businesses online.
As a result, 20%-30% of grocery stores created an online store to accept online purchases at the peak of the pandemic.

According to studies, over half (55%) of the US population now order groceries online – while only 36% used to order groceries online pre-covid.
This is an increase of almost 20% in less than 5 years!
The Boom Of Mobile Payment
As people spend more and more money online, the convenience of proximity mobile payments also became popular and much more common.
The number of people worldwide using proximity mobile payments has grown by 22% year over year since 2020.
Social Media Pushed Sales
Social commerce, which is selling products directly on social media sites such as Facebook and Instagram, also skyrocketed.
In 2020, social commerce made up a total of 3.4% of all retail ecommerce sales.
This isn’t going to slow down any time soon. Social commerce is expected to grow 3 times as fast as traditional ecommerce globally…
- From $492 billion in 2021
- To $1.2 trillion by 2025
People Bought More Goods
Recreational goods spending increased by over 18% between 2019 and 2020.
The US ecommerce market experienced the most significant benefit from the pandemic.
The COVID-19 related boost in online shopping resulted in an additional $218 billion in sales in the US alone.

If there is one thing we can say about these ecommerce statistics…
The COVID-19 pandemic was a catalyst for big growth across the whole sector – even creating new and unexpected ecommerce sectors.
Ecommerce Trends Statistics
As technology grows so does ecommerce.
It’s a fast, constantly-changing industry.
These ecommerce statistics show the current trends in the booming industry.
1. Mobile Ecommerce
The world has gone mobile.
So it makes sense that people are using their smartphones for online shopping. More than 90% of people regularly use a smartphone for shopping online.
And businesses are encouraging online shopping with the development of interactive mobile apps.
In 2026, Temu, Shein and Amazon are the 3 most downloaded shopping apps.
To go further:
79% of smartphone users have purchased a product or service using their mobile device in the last 6 months.
Why is mobile ecommerce trending?
3 out of 4 (75%) consumers say they use smartphones and tablets to purchase online because it saves them time.
Like most things mobile, it’s all about convenience.

But as mobile shopping increases, so do the expectations from consumers.
Over 90% of shoppers say that their experience on mobile ecommerce could be better. Clearly, the vast majority of online shoppers say that there is huge room for the mobile ecommerce world to improve.
What are the biggest concerns they have?
The 2 biggest issues that people say are hindering their experience with mobile shopping are:
- Links/buttons that are too small to click
- Security – people don’t feel their info are “safe”
People need to feel comfortable that their data is protected in order to shop online without worry.
But despite that, experts predict that they will be 199.50 million mobile shoppers in the United States by 2026.
2. Digital Payment
Digital payments have been growing in popularity.
The fact that you can now buy products and services online without the need to pull out your card is a convenience many people have taken hold of.
Digital payment methods are often a more secure way to make payments online as well.
The two most popular forms of digital payment worldwide are-
- Digital wallets – Payments made in the form of an app
- Mobile wallets – Payments made from a credit/debit card on your phone
49% of users worldwide regularly use digital payments for online purchases and shopping.

These are the most popular digital payment services:
| Digital Payment Service | Users |
|---|---|
| AliPay | 1.3 Billion |
| WeChat Pay | 1.2 Billion |
| Apple Pay | 570 Million |
| PayPal | 392 Million |
| Google Pay | 150 Million |
| Zelle | 86 Million |
| Digital Currencies | 82 Million |
| Venmo | 52 Million |
| Amazon Pay | 40 Million |
| Cash App | 30 Million |
Services like Apple Pay and Google Pay have become a big part of ecommerce payments for both customers and merchants in the United States.
But Visa, MasterCard and PayPal are still the primary payment methods accepted by ecommerce stores.
In fact, 99.9% of ecommerce sites accept Visa and MasterCard and about 72% of them accept PayPal.

Interestingly, the Chinese payment market is dominated by:
- Alipay
- WeChat pay
They have a combined 2.5 billion user base worldwide, making them the most popular digital payment services by far.
Germans still prefer direct bank transfers called ELV (Elektronisches Lastschriftverfahren), a payment method supported by most banks in Germany.
This is an alternative payment option for customers who don’t like using credit or debit cards to pay for goods and services.
3. Consumer Behaviour
When do most people buy online?
Most people think of a person sitting on their computer at the kitchen table browsing online.
The results are a little different:
- 43% of online buyers said they regularly make purchases in bed
- 23% admitted to purchasing at the office
- 20% purchase while in the bathroom or in the car

How frequently do people buy online?
According to studies, 31% of online shoppers buy a product once a month.
The following table illustrates the percentage of online shoppers based on their buying frequency:
| Frequency | Share (%) |
|---|---|
| Once Per Week | 20% |
| Once Every 2 Week | 24% |
| Once Per Month | 31% |
| 3-4 Times Per Quarter | 15% |
| Once Every 2 Weeks | 10% |
But that’s not all.
There are times when people shop online more than usual (for example: Thanksgiving, sales, Black Friday, Cyber Monday, etc).
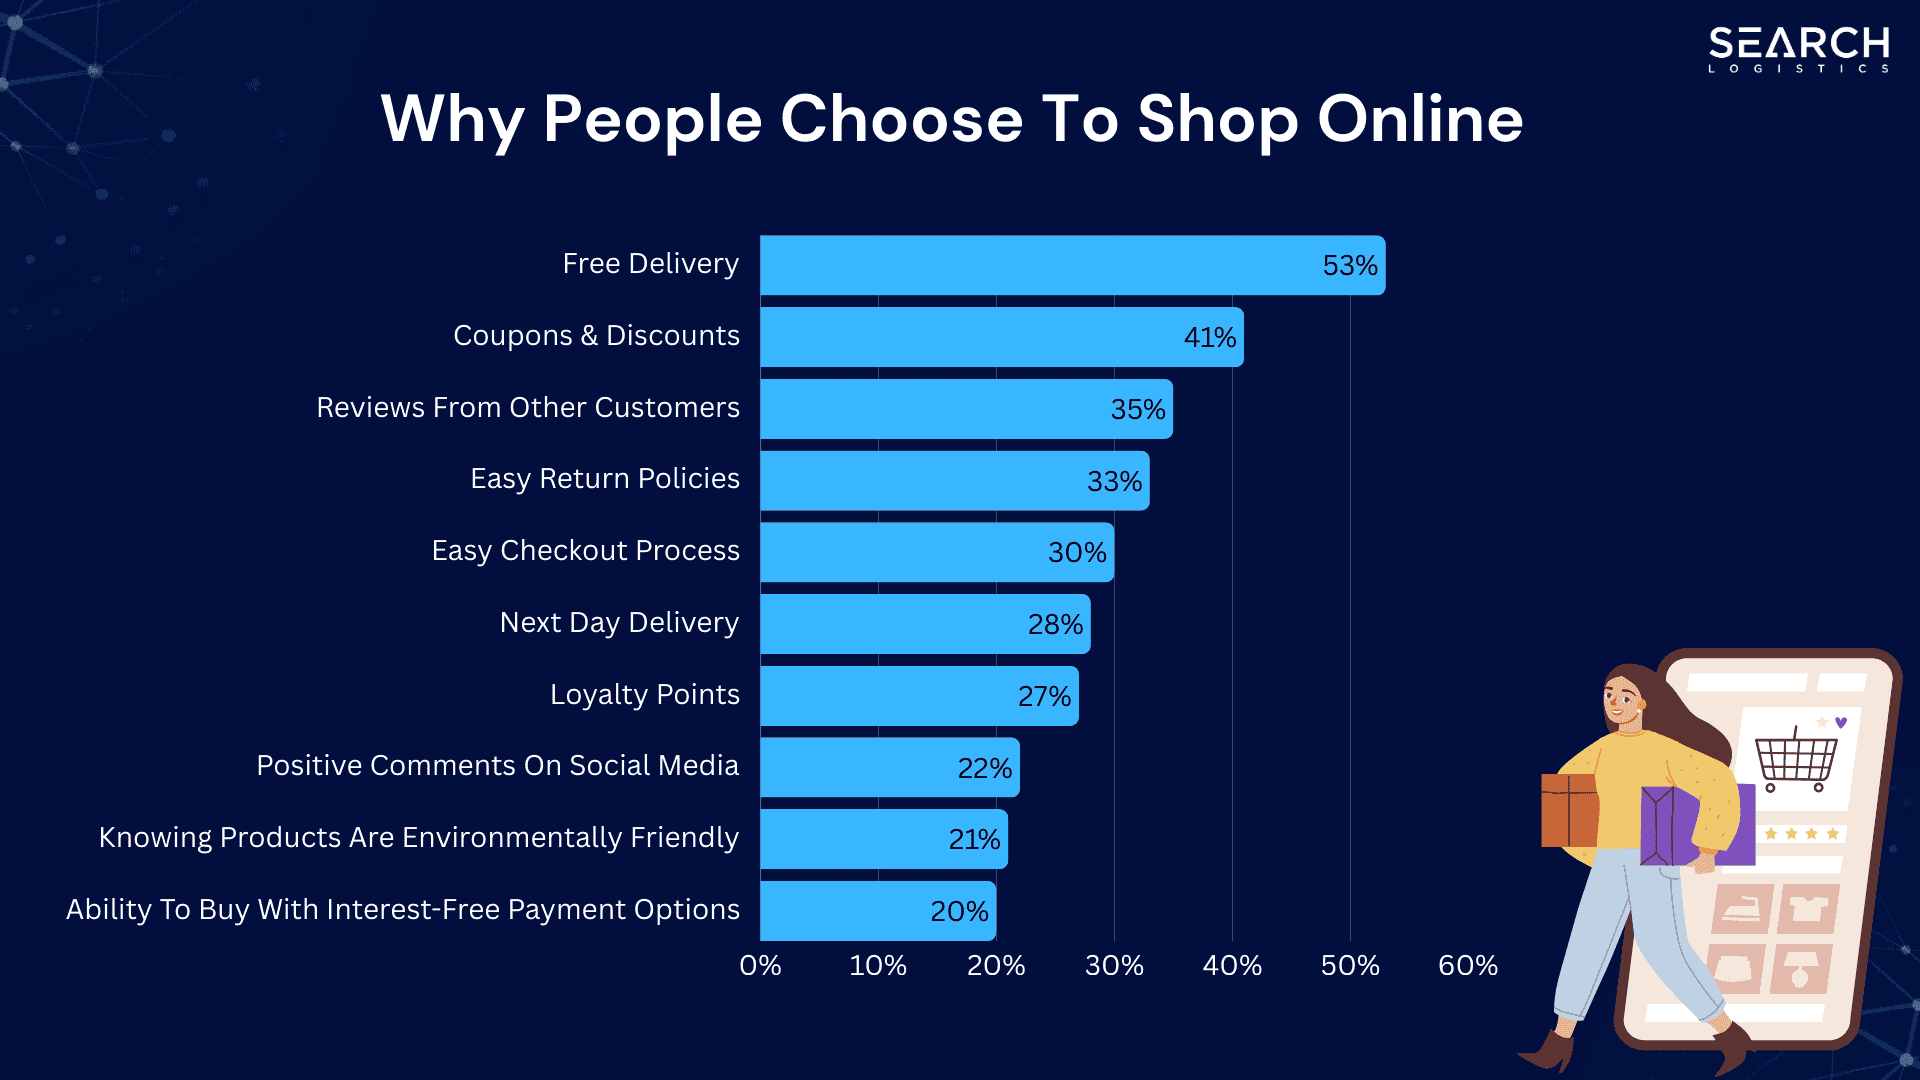
Now, why do people choose to buy online?
The most common reason people purchase online is the free delivery.
As ecommerce becomes the normal way to shop, there is an expectation that products should come with free shipping.
But there are lots of other reasons to shop online too.
If you are an ecommerce store looking to increase sales, pay attention to the following ecommerce statistics.
These are the top reasons why people choose to shop online today:
| Reason | Percentage Of People (%) |
|---|---|
| Free Delivery | 53% |
| Coupons & Discounts | 41% |
| Reviews From Other Customers | 35% |
| Easy Return Policies | 33% |
| Quick & Easy Checkout Process | 30% |
| Next Day Delivery | 28% |
| Loyalty Points | 27% |
| Lots Of Positive Comments On Social Media | 22% |
| Knowing Products Are Environmentally Friendly | 21% |
| Ability To Buy With Interest-Free Payment Options | 20% |
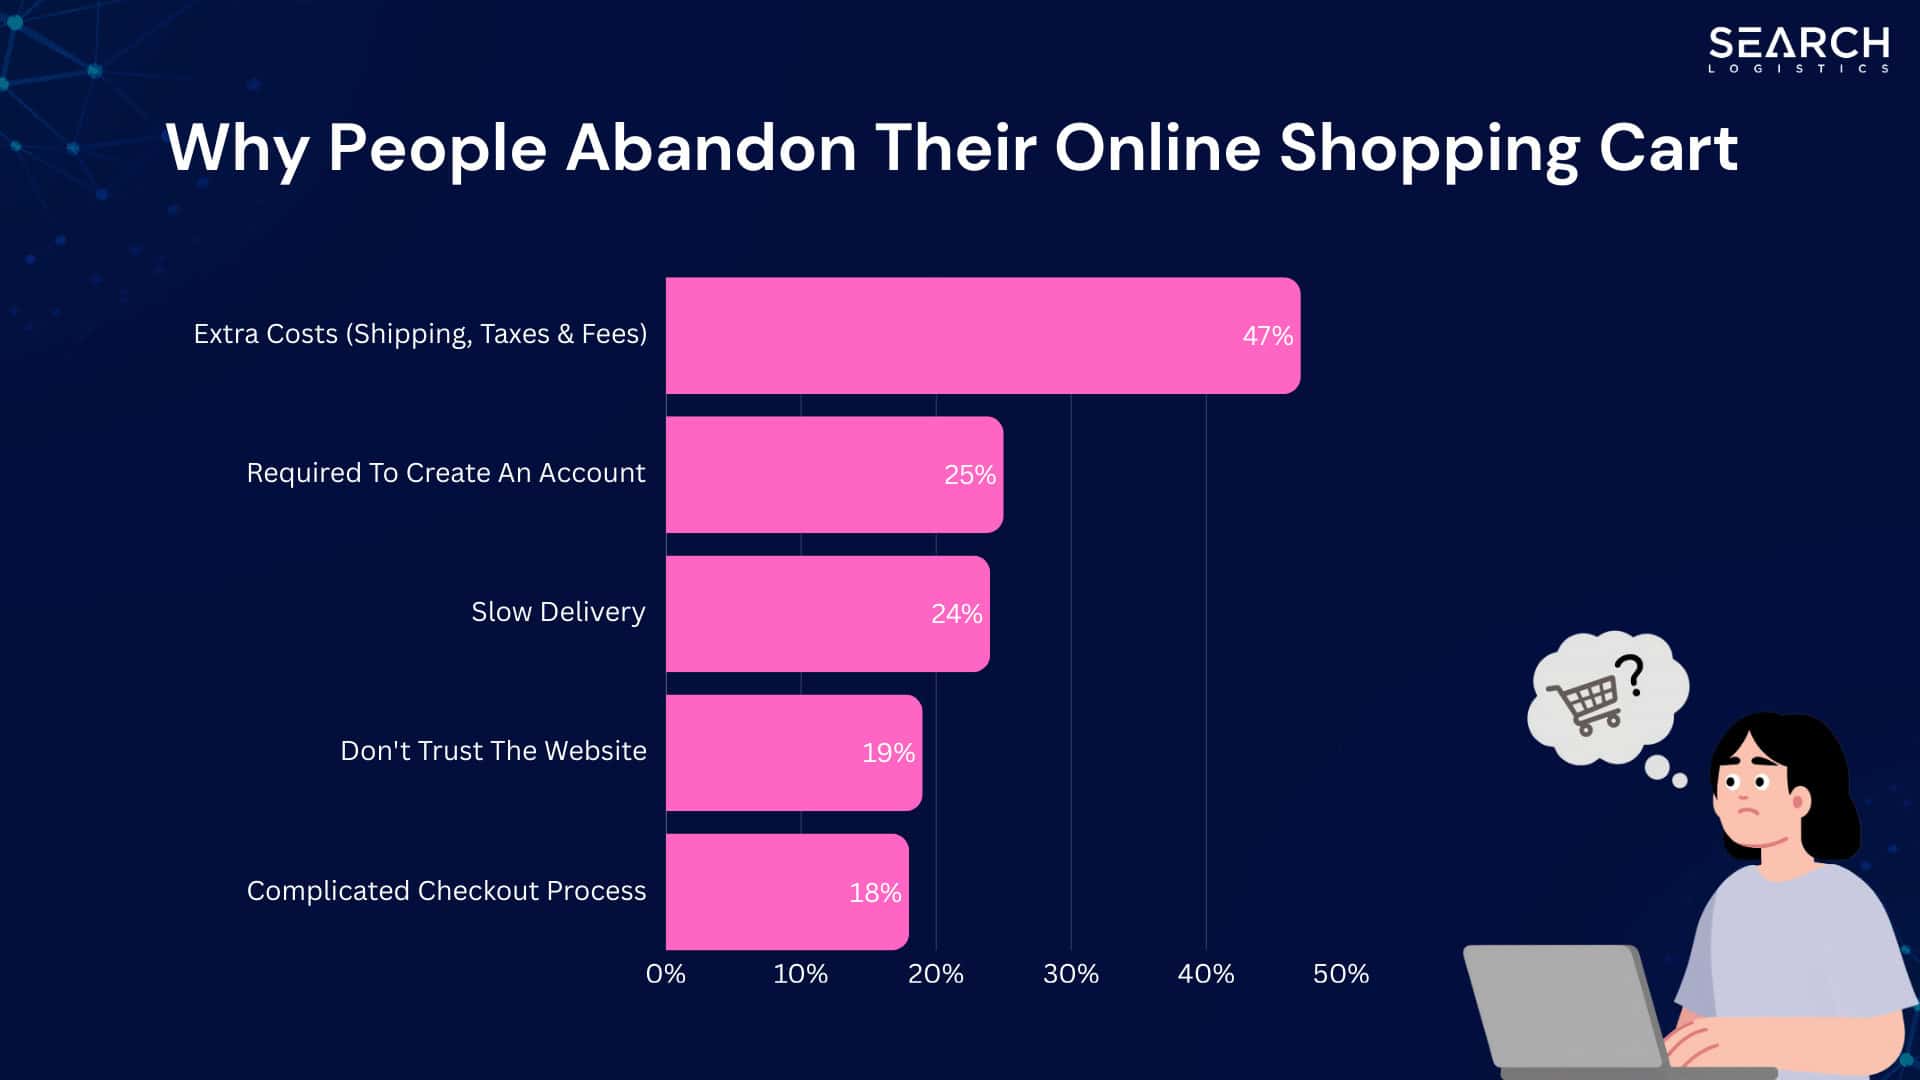
Interestingly the main reason people don’t end up buying online is because shipping isn’t free.
In fact, the online shopping cart abandonment rate is a about 70%.
So, what makes people abandon their online carts?
These are the top reasons why people choose to abandon their online cart:
| Reason | Percentage Of People (%) |
|---|---|
| Extra costs (shipping, taxes and fees) | 47% |
| Required to create an account | 25% |
| Slow delivery | 24% |
| Don’t trust the site | 19% |
| Complicated checkout process | 18% |
The big takeaway?
If you aren’t offering free shipping on your ecommerce store, it might be time to think about adding it.
What’s more?
More than ⅓ of customers will go online and look up a price while they are in a brick-and-mortar store.

This means that even though customers might be in a physical store, over 33% of them could still be shopping online at the same time.
Content should be a priority for all ecommerce store owners.
Not only will it improve your ecommerce SEO, but 81% of customers research a product before making a purchase decision.

Great content can help move your customers down the funnel quickly.
According to studies from BCG, highly personalised content increases ecommerce revenue.
In fact, personalised content makes customers 110% more likely to add more items to their basket.

What’s more?
Personalised content can increase revenue by over 25% and improve your customer’s chances of spending more than they initially planned by over 40%.
The bottom line is this…
Personalised content that connects with your customers can result in a significant increase in sales and revenue.
4. Social Media & Influencers
Influencer marketing has become a standard marketing strategy for ecommerce businesses and companies all over the world.
Why?
Put simply – it works.
40% of shoppers made a purchase because of social media influence.
What’s more?
13% of consumers are willing to spend more money on a product that is promoted by an influencer or celebrity.
They want to hear the opinions of others to help them make buying decisions.

For consumers aged 26 to 35, that figure increases to 22%
The younger generations are more likely to buy when an influencer advertises the product.
About 70% of teens trust influencers more than traditional celebrities, while 86% of women use social media for purchasing advice.
But it doesn’t stop there.
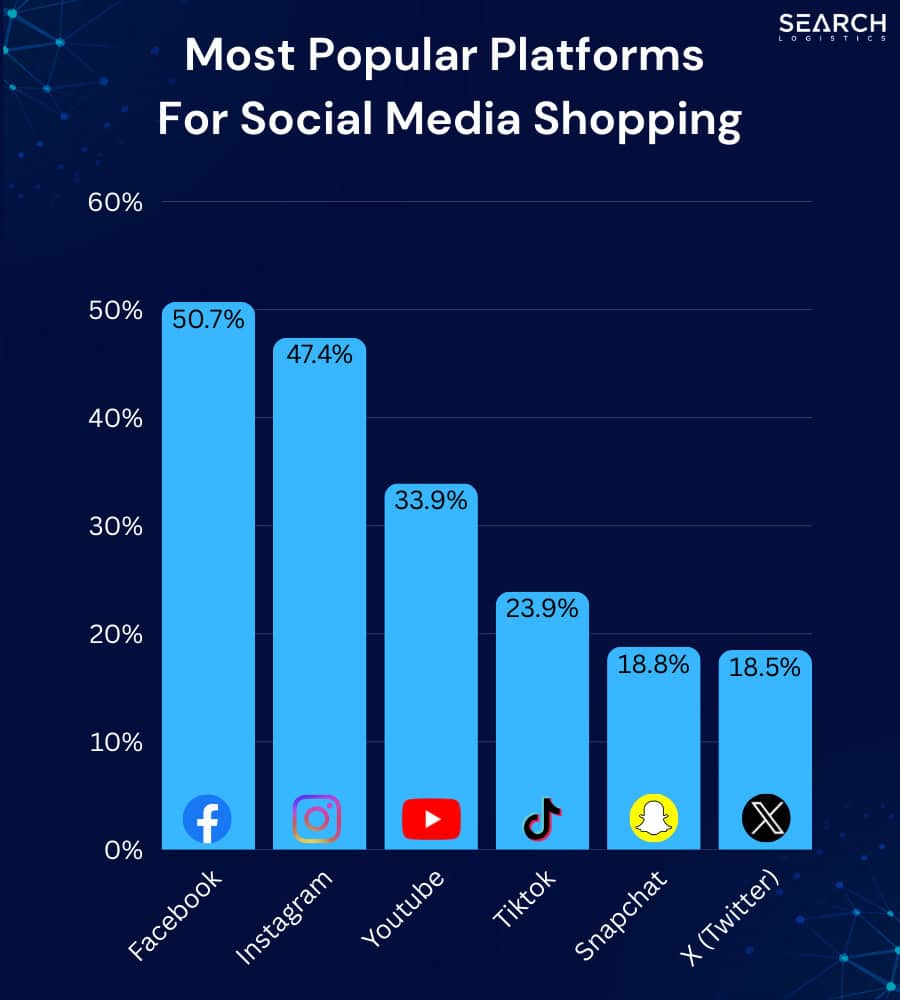
Global social e-commerce statistics show that social commerce reached $821 billion in 2025, and is on pace to pass $1 trillion by 2028.
Here are the most popular platforms for social media shopping:
| Social Media Platform | Percentage Of People Who Purchased From The Platform (%) |
|---|---|
| 50.7% | |
| 47.4% | |
| Youtube | 33.9% |
| Tiktok | 23.9% |
| Snapchat | 18.8% |
| X (Twitter) | 18.5% |
While buying on social media is increasing as a trend, 57% of people still prefer to complete their transactions through the online retailer’s site.
Just 18.7% of people completed the transaction through the social media app.
These numbers are expected to change significantly over the next years.
Ecommerce Statistics By Country
When it comes to ecommerce statistics by country, most people would assume that the United States would be the biggest spender.
But that’s not actually the case. While the US online market is more established, other countries are catching up quickly.
These are the countries that have the biggest adoption of ecommerce shopping:
| Country | Ecommerce Market 2021 |
|---|---|
| China | $2.1 Trillion |
| United States | $843 Billion |
| United Kingdom | $169 Billion |
| Japan | $144 Billion |
| South Korea | $120 Billion |
Let’s look at some of these ecommerce statistics in more detail.
China
China is leading the world in ecommerce and online shopping adoption.
They had 792.5 million digital buyers in 2021. That’s more than double the entire population of the United States.
And it’s not slowing down anytime soon…
China is expected to be the first country in the world to have more than 50% of total retail sales happening online.

There are a number of reasons that ecommerce in China is exploding:
- Faster internet speeds
- Huge smartphone adoption
- Consumer confidence in online shopping
- More trusted ecommerce platforms
- Safe ways to pay such as Alipay and WeChat pay
In fact, the Chinese ecommerce market is expected to reach over $3.3 trillion by 2025.

In 2021, it was $2.1 trillion.
As of now the biggest ecommerce platform in China is Alibaba with a total market share of 51%, handling nearly $1.12 trillion in merchandise sales.
United States
The United States comes in second for ecommerce adoption and spending.
There are 274.70 million online buyers in the United States as of 2023 – which represent more than 81% of the total population of the United States.
Here is a table that breakdown how many people have been shopping online in the United States over the years:
| Year | Number Of Online Buyers |
|---|---|
| 2017 | 215.50 million |
| 2018 | 234.80 million |
| 2019 | 243.60 million |
| 2020 | 252.70 million |
| 2021 | 264.50 million |
| 2022 | 268.20 million |
| 2023 | 274.70 million |
| 2024 | 279.90 million |
| 2025* Predicted |
284.60 million |
| 2026* Predicted |
288.20 million |
In 2023, the total retail e-commerce sales in the United States were $1,072.81 billion.
In the US, online shopper conversion rates amounted to 2.57%, which is increasing steadily.
Increased sales growth and higher conversion rates mean that the US ecommerce market is set to continue to grow for years to come.
This is despite the fact that 81% of US citizens already shop online, which means ecommerce market penetration is already high.
It’s also likely that ecommerce will take retail sales from brick-and-mortar stores which should improve the market growth.
Shopping apps are popular amongst ecommerce shoppers in the US.
57% of digital buyers say they use a retailer’s app to check prices when they are physically present in the store.
This trend shows that savvy shoppers will check to see if they can get it cheaper online. Even if that means waiting an extra couple of days for the product.
To go further:
Online buyers spend an average of $5381 in the United States as of 2023 but experts predicts that the average spend of online buyers would be $7,250 per person/year in the United States by 2026.
United Kingdom
The UK ranks third in ecommerce adoption. In 2021, the total ecommerce market size in the UK was $169.02 billion.
This is significantly less than the US and China.
About 50 million UK consumers regularly shop online.
This means approximately 74.3% of all UK citizens shop online, which is a high market penetration for ecommerce.
Retail ecommerce sales accounted for 37.5% of the total UK retail sales.

This is expected to grow but not as fast as many other countries.
From 2021 to 2025, experts predict that retail ecommerce sales in the UK will only grow at an annual rate of 5.16%.
These UK ecommerce statistics could mean two things:
- The adoption of ecommerce in the UK is reaching its capacity
- UK citizens still like to shop in physical stores
Mobile devices are likely to become the new way to pay for online sales.
Mobile devices were used to make 67% of online shopping purchases in the UK during the 3rd quarter of 2021.
As mobile payments make shopping online more convenient, it’s possible that this could drive most of the future growth for ecommerce in the UK.
Canada
Ecommerce in Canada exploded during the COVID-19 pandemic.
It grew by more than 70% during 2020 alone.
In 2021 the growth rate slowed significantly to just 14%. Experts predict that this will likely be the annual average growth rate until 2025.
Clearly, the pandemic made a massive difference to the ecommerce market in Canada.
In 2019, total ecommerce revenue from retail sales in Canada was $25.4 billion. It is projected to exceed $90 billion by 2025.

This will mean that Canada is likely to remain in the top 10 countries in terms of ecommerce market size.
Currently, Canada ranks 8th in the world.
The biggest drivers for online sales for Canadians are the cost of items and savings.
These 2 critical factors are considerations most Canadians make before purchasing online vs purchasing from a physical store.
Japan
Japan ranks 4th in terms of ecommerce market size. But that might not be the case for much longer.
The annual ecommerce growth rate in Japan is relatively slow compared to the rest of the world at just 6% per year.
74.1% of the Japanese population (about 100 million people) shop online already.

This is expected to reach about 89% by 2025.
Why the slow growth rate then?
Japan has an ageing population.
While older people in Japan are adopting ecommerce shopping slowly, they still purchase most products from physical stores.
This is why ecommerce growth may not be as fast in the future.
The biggest category for ecommerce transactions in Japan is travel.
This is significantly different from other countries such as China, the United States and the United Kingdom.
Japanese online shoppers are also slow to take up digital payment methods. Most Japanese online shoppers still prefer to pay using a credit or debit card.
Ecommerce Statistics By Industry
Global retail ecommerce sales peaked during the pandemic despite huge issues with the supply chain.
So what do people buy?
Here are the ecommerce statistics on the biggest industries right now.
Fashion
Fashion is one of the top ecommerce markets. It’s expected that the average online shopper will spend $921 on fashion-related items in 2022.
Fashion isn’t just a stable ecommerce sector – it’s one of the fastest-growing sectors.
Ecommerce clothing and apparel growth rates between 2017 and 2021 were:
- 8.1% in the United States
- 8.7% in Europe
- 14.1% in China

By the end of 2022, apparel and accessories will be the fastest-growing category in ecommerce sales increasing by an expected 18.9%.
In the US alone, ecommerce fashion sales are expected to reach over $295 billion by 2025. Sales were $180 billion in 2021.

The COVID-19 pandemic didn’t seem to accelerate growth in fashion sales as much as in other industries.
The growth rate remained relatively consistent in terms of growth for both 2020 and 2021.
Beauty & Personal Care
Beauty and personal care is another hugely popular industry for online ecommerce.
And it’s only going to get bigger. The beauty and personal care online market is predicted to increase by 48% by 2023.

To get an idea of how big the market is already, personal care online retail sales generated $332 billion in 2020.
This was a massive increase in 2019, growing by 28.5%.
Entertainment
Online purchases for entertainment are predicted to grow significantly over the next 5+ years.
Allied Market Research estimated the value of online entertainment to be $183 billion in 2019. By 2027, they say it is estimated to reach $652.5 billion.

That means the growth rate will be about 356.5% over the next 5 years.
The fastest-growing entertainment niches in ecommerce are-
- Books
- Music
- Video
An estimated 95.6% of Americans aged 13 and older listen to some form of audio (music, podcast etc) every day.
The average American reads an average of 12 books per year. Print book sales have increased by more than 8.9% since the start of the pandemic in 2020.
Online and ecommerce platforms make all these 3 sources of entertainment more accessible more often.
Household Goods
DIY home projects grew in popularity during the pandemic.
So it makes sense that the tools and products needed to complete those projects did too. Home repair tools and online equipment retailers saw an 8% growth rate in sales in 2020.
Household goods are not typically a high-growth industry.
The outdoor home landscape niche also saw decent growth. In 2020, outdoor living furnishings and gardening equipment sales grew by 9%.

The pandemic was clearly a time for many people to work on their homes and gardens.
Electronics
Consumer electronics is another popular category that dominates the ecommerce world.
Electronics in the US generated $117 billion of revenue in 2020. This was 22% of the entire ecommerce market.
Amazon is where most people go to buy electronics. It leads the US market in electronics sales generating $61.4 billion in revenue from electronics in 2020.
Computer and consumer electronics account for 53.2% of the total retail sales in the US.
Ecommerce Market Leaders Statistics
The truth is that most of the ecommerce market is controlled by big platforms and marketplaces.
Here are the market leader statistics for both.
Ecommerce Platforms
Ecommerce platforms provide solutions for anyone to set up an online store and start selling products.

These are the ecommerce platform statistics you need to know.
1. Shopify
There aren’t many people who haven’t heard of Shopify.
Shopify powers more than 4 million stores in the world.
One of the reasons Shopify is so popular is because of how easy it is to create great-looking online stores.
79% of all Shopify traffic comes from mobile devices and their mobile experience is one of the best of any ecommerce platform in the world.
Shopify also has a huge app store. There are more than 3,200 apps available made by developers from more than 175 countries.
Apps are part of what has made the Shopify platform so successful.
2. WooCommerce
WooCommerce is an ecommerce plugin for WordPress.
It can turn your WordPress website into a fully functional and robust online store.
How popular is it?
There are currently 3.8 million live websites that use WooCommerce on WordPress to power their online storefronts.
Of all WordPress site owners who sell products on their website, 93% of them use WooCommerce.
Since the beginning of WooCommerce, the plugin has been downloaded 123 million times. It’s the biggest ecommerce platform in the world.
Ecommerce Marketplaces
All of the ecommerce platform statistics might seem pretty big.
But they are tiny compared to the huge ecommerce marketplaces that dominate the online shopping world.
Here is a table of the most visited ecommerce stores by monthly traffic:
| Website | Traffic |
|---|---|
| amazon.com | 3,161.64 million visitors |
| ebay.com | 589.1 million visitors |
| walmart.com | 581.22 million visitors |
| aliexpress.com | 486.47 million visitors |
| etsy.com | 467.64 million visitors |
| amazon.de | 340 million visitors |
| rakuten.co.jp | 278.59 million visitors/td> |
| homedepot.com | 200.74 million visitors |
| target.com | 194.91 million visitors |
As you can see, amazon.com is the most visited website in the world, followed by ebay.com and walmart.com.
Check out the following mind-blowing ecommerce statistics.
1. Amazon
There aren’t many marketplaces more well-known than Amazon.
Amazon is the most popular shopping platform in the world, with 3,161.64 million visitors – including 150.6 million american visitors accessing the app every month.
They have more than 300 million monthly active users across all devices.

How much do those people spend?
Over $600 billion of goods were sold through Amazon in 2021.
Not only that but they ship over 66,000 orders per hour, totalling about 1.6 million packages every single day.
In 2020, Amazon brought in $386 billion in revenue, making it the 3rd biggest company globally by revenue.
In the fourth quarter alone of 2020, Amazon brought in $125.6 billion in revenue.
As of 2021, Amazon has over 200 million Prime subscribers – 150 million of them are located in the US. Their subscription services made them about $25.21 billion in 2020.
86% of buyers say that they are more likely to buy products from Amazon more than any other ecommerce marketplace.

The trust that Amazon has built with their customers is their secret to its success.
The most popular Amazon category is electronics. 44% of US Amazon shoppers have purchased some sort of electronics through Amazon.
2. eBay
eBay used to be the biggest marketplace online.
But Amazon has pushed well out in front in recent years. But that doesn’t mean eBay isn’t a force to be reckoned with.
There are 187 million eBay users worldwide. The eBay app is used by 34.9% of all US smartphone owners.
$27.5 billion worth of goods were bought and sold on the eBay marketplace in the first quarter of 2021.
A total of $87.4 billion of goods were sold through eBay in 2021.

This was slightly down on the $87.6 billion in 2020 and well below their peak of $89.83 billion in 2018.
Although eBay is still widely popular, it looks like they are struggling to grow.
Wrapping It Up
One thing is for sure…
There has never been a better time to start an ecommerce store and brand.
These ecommerce statistics paint a clear picture that consumers will continue to buy online.
If anything…
That one ecommerce statistic alone says it all.
Want more statistics posts? Take a look at these blogs: