


Social media has been around since 1997.
But it wasn’t until 2004 that social media really began to take off.
Now there are 5.66 billion people that use social media worldwide.
That’s more than half of the total world population!
The rapid growth in social media usage has completely changed the way we live and interact with each other.
But is this growth starting to slow?
I’ve compiled a list of the latest social media user statistics showing just how big social media has become and where it’s likely to go in the future.
What Will I Learn?
Key Social Media Statistics
Billions of people rely on social media every day.
There are hundreds of social media sites that vary in size and function.
These are the key social media statistics that you need to know:
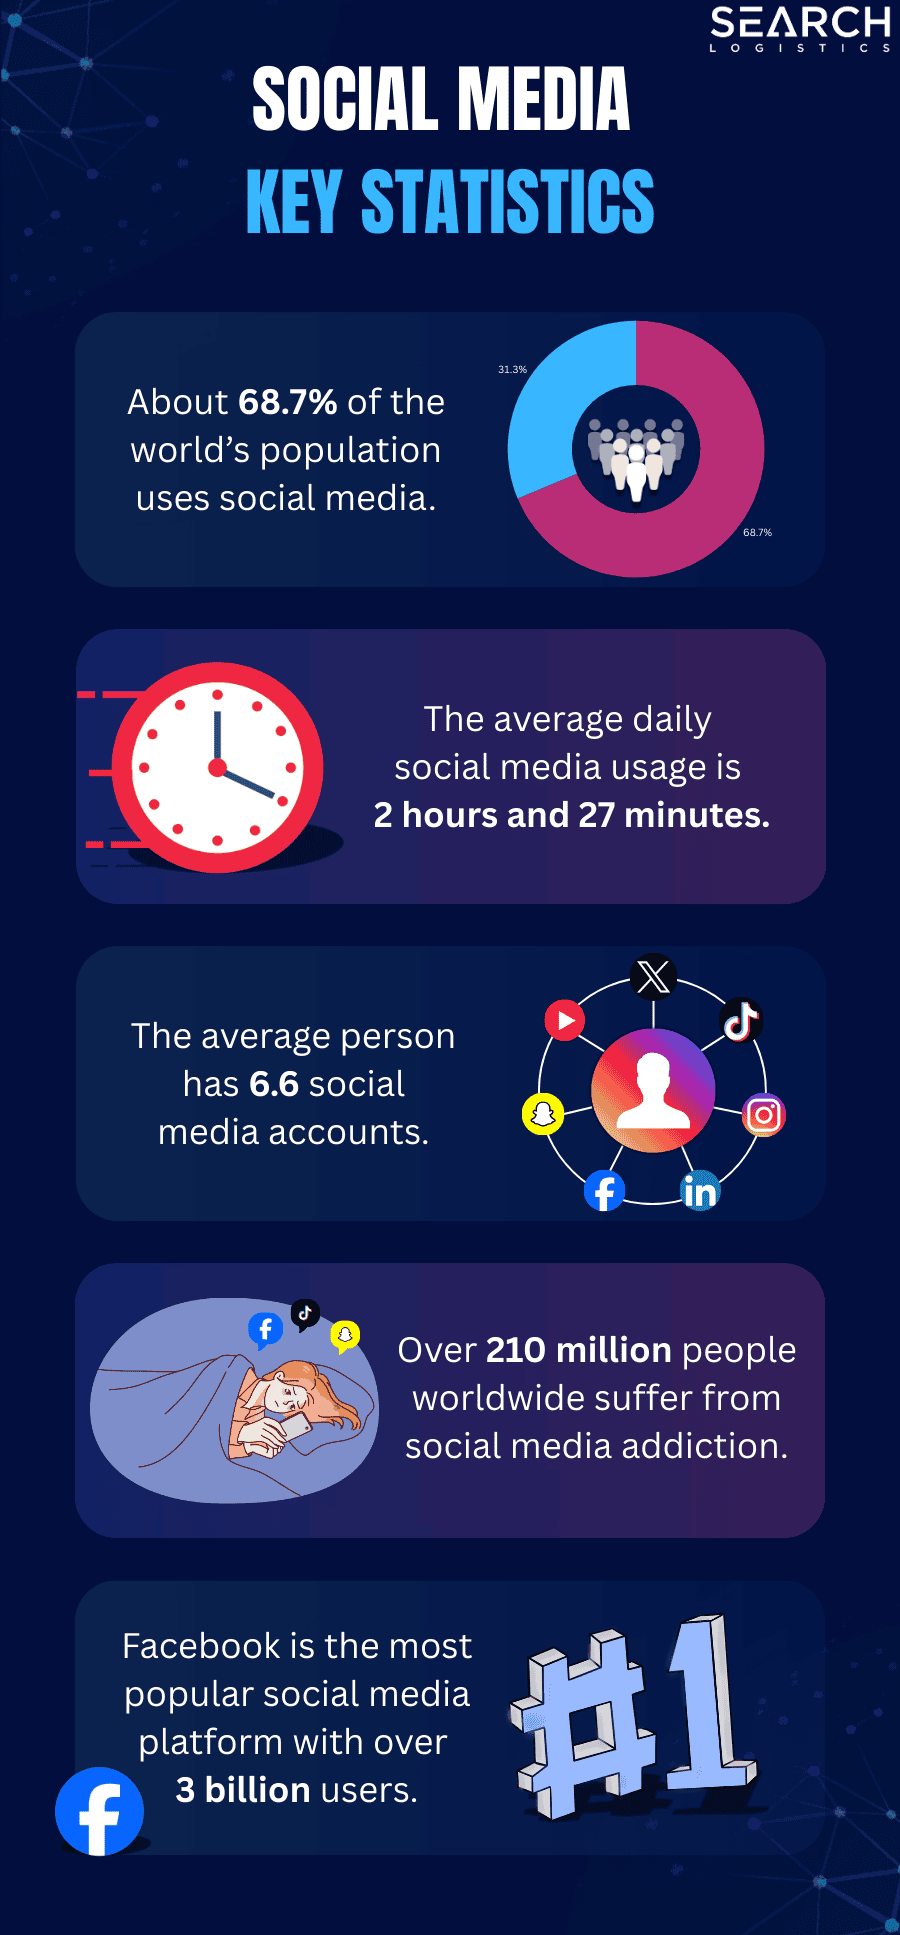
- About 68.7% of the world’s population uses social media today
- That equates to 5.66 billion people around the world now using social media
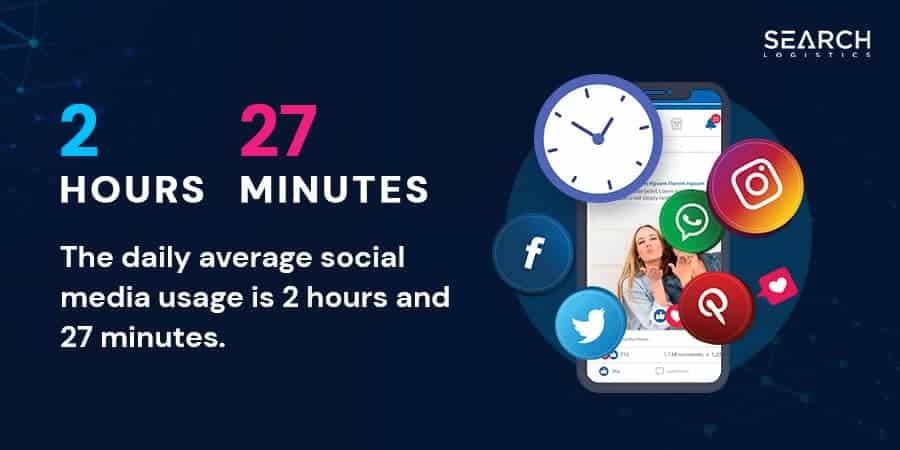
- The average daily social media usage is 2 hours and 27 minutes
- The average social media user has an account on 6.6 social media platforms
- Almost 75% of the world’s population over the age of 13+ uses social media in some form
- 93% of people who use the internet regularly also use social media
- 72% of all Americans actively use social media
As you can see, social media is a big part of our daily lives. But is demand growing or slowing down?
Social Media Worldwide Usage Statistics
Time on social media is increasing.
The average time spent on social media increased by 2 minutes in 2021 compared with 2020.
While this doesn’t sound like much – when you consider the number of people on social media, it adds up to a lot of extra usage.
Which countries spent the most and least time on social media?
- Nigeria
- The Philippines
- Ghana
- Japan
- The Netherlands
- North Korea
Most North Koreans don’t have access to the internet, let alone social media. The North Korean Government does have a large social media account on Twitter/X.
The daily average worldwide social media usage is now 2 hours and 27 minutes.
The United States dips below that, with an average of 2 hours and 14 minutes spent on social media daily.
When you break this data down by age demographic, the average time spent each day on social media changes significantly:
| Age Group | Average Daily Time Spent On Social Media |
|---|---|
| 16 to 24 | 3 hours and 1 minute |
| 25 to 34 | 2 hours and 37 minutes |
| 35 to 44 | 2 hours and 4 minutes |
| 45 to 54 | 1 hour and 39 minutes |
| 55 to 64 | 1 hour and 13 minutes |
Interestingly when you break it down further by gender, men aged 20 to 29 spend the most time on social media.
For women, those aged 16 to 24 years old spend the most time on social media with an average of 3 hours and 18 minutes per day.
This is only slightly above the average when you consider both genders.
How many social media platforms do people visit?
The average user will visit 7.5 social media platforms each month. So all of that time spent on social media is divided into multiple platforms.

Not one specific platform completely dominates the market.
People generally use social media for three main reasons:
- Staying in touch with friends and family
- Filling spare time
- Reading the latest news
A recent case study estimates that the average person will spend about 5 years and 4 months of their life on social media.
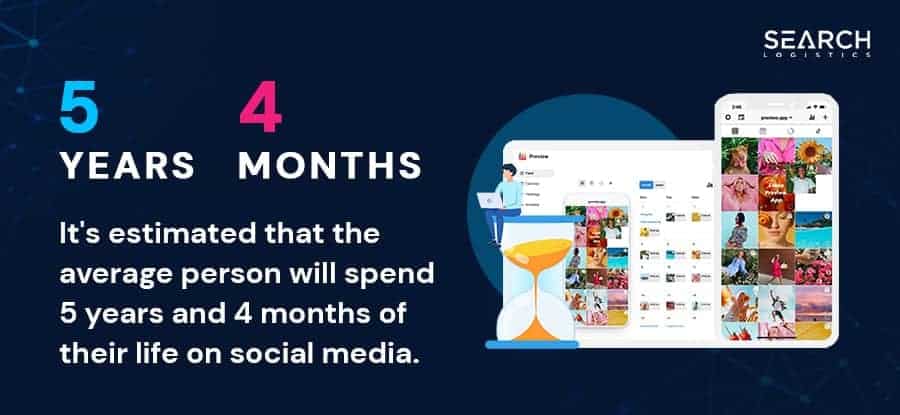
That’s more time than they will spend eating and drinking!
But maybe more shocking than that is…
7.3% of the average person’s life will be spent only on social media.
Social Media Worldwide Advertising Statistics
Advertising is an important part of social media.
Why?
Because that’s how most social media platforms make money.
It’s also a good opportunity for businesses to reach their target customers with relevant ads.
Here are the leading benefits of social media marketing according to marketers worldwide:
| Benefits Of Social Media Marketing | Share Of Respondents (%) |
|---|---|
| Increased exposure | 81% |
| Increased traffic | 71% |
| Generated leads | 62% |
| Developed loyal fans | 58% |
| Improved sales | 46% |
So how much do businesses spend on ads?
Between 2019, the last year before the pandemic, and 2024, global social media advertising spending skyrocketed by 140%, surpassing an estimated $230 billion in the latter year.
One of the biggest drivers of this growth is video.
Global spending on digital video advertising exceeded $190 billion in 2024.
With the rise of video-based platforms like YouTube and TikTok, videos are becoming more popular.
Even Instagram has switched from images to more videos.
Digital marketing statistics show that video ads also tend to perform better for businesses taking advantage of advertising on social media platforms.

But here is the catch:
Consumers are more worried about their privacy than anything else.
52% of social media users say that when a platform does a good job of protecting their privacy and data, it significantly impacts their decision to interact with ads on the platform.
In other words: The more a social media site protects its users, the better results advertisers can get.
Facebook Statistics
![]() Facebook is the largest social media network on the planet.
Facebook is the largest social media network on the planet.
Despite a lot of recent bad press, Facebook has continued to grow as a platform worldwide.
These are the latest social media user statistics about Facebook.
Facebook Users
How many users does Facebook have?
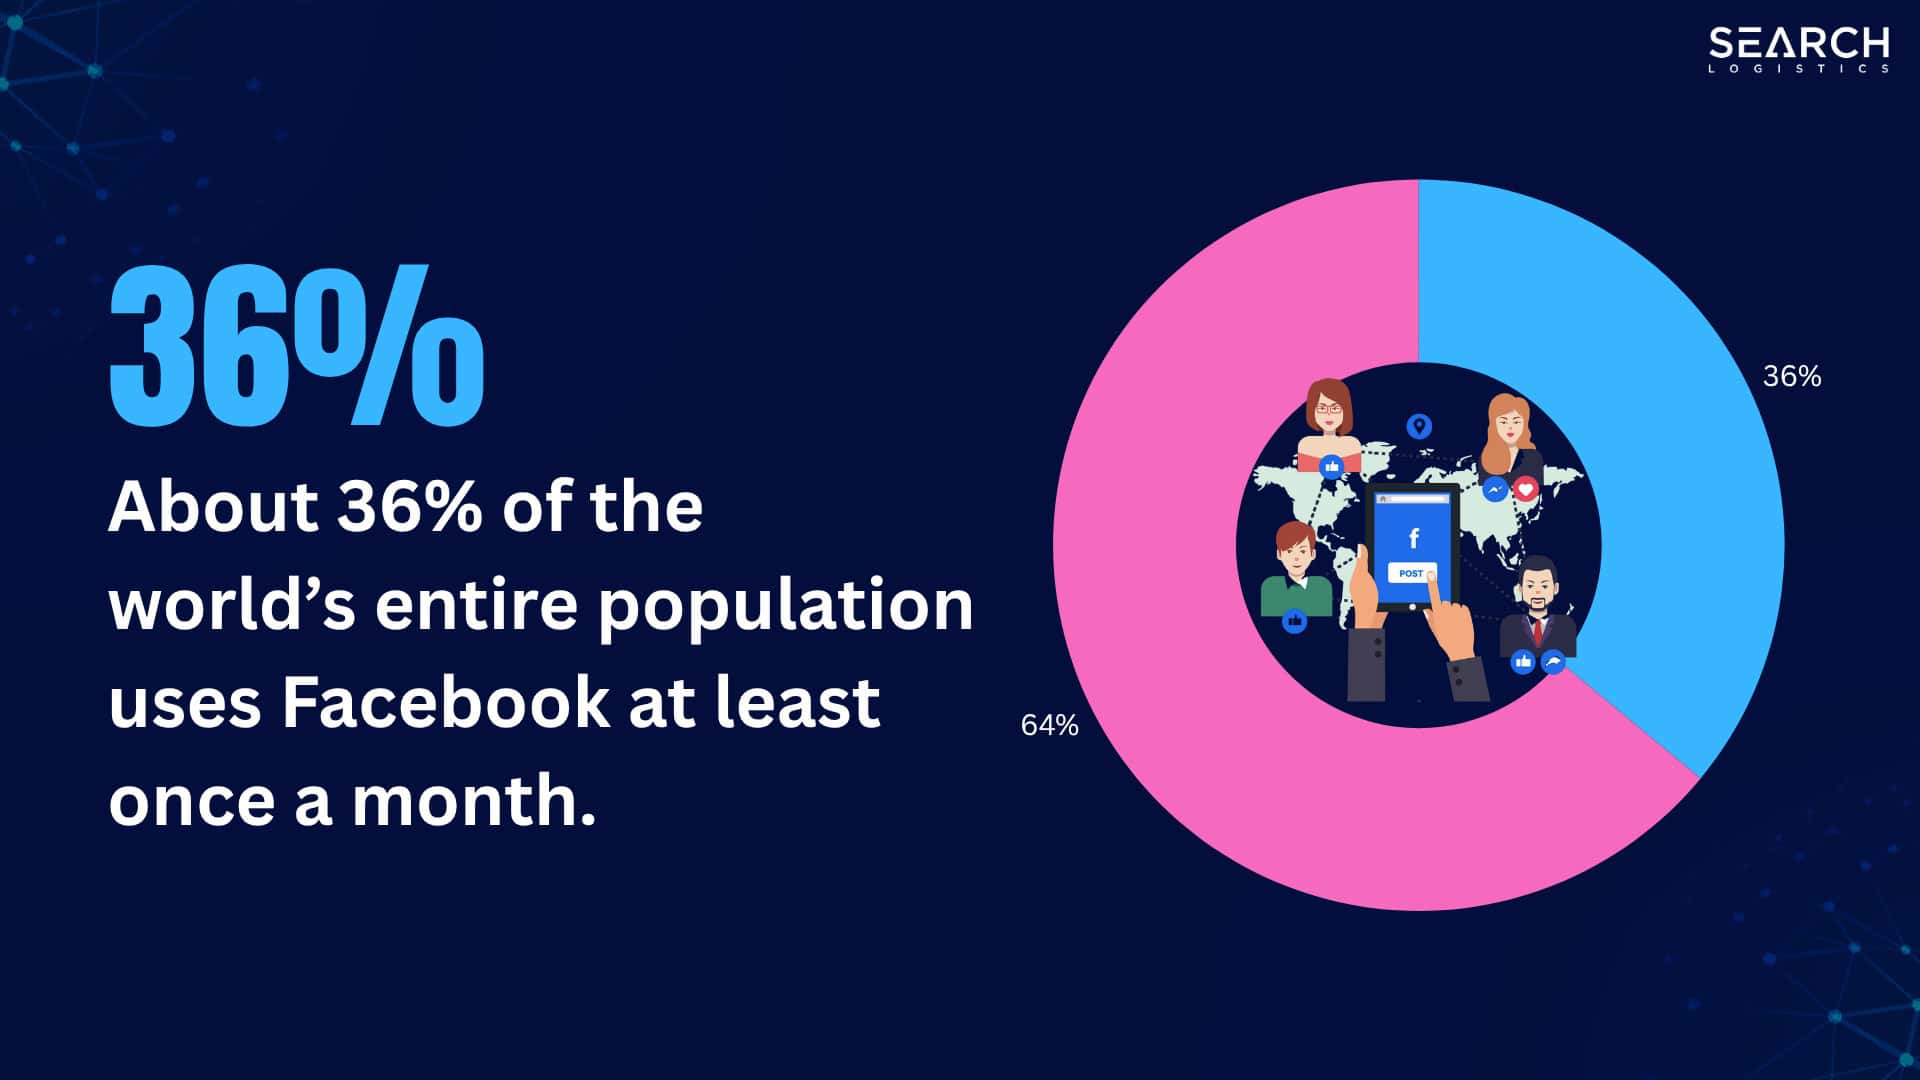
Facebook has over 3 billion monthly active users.
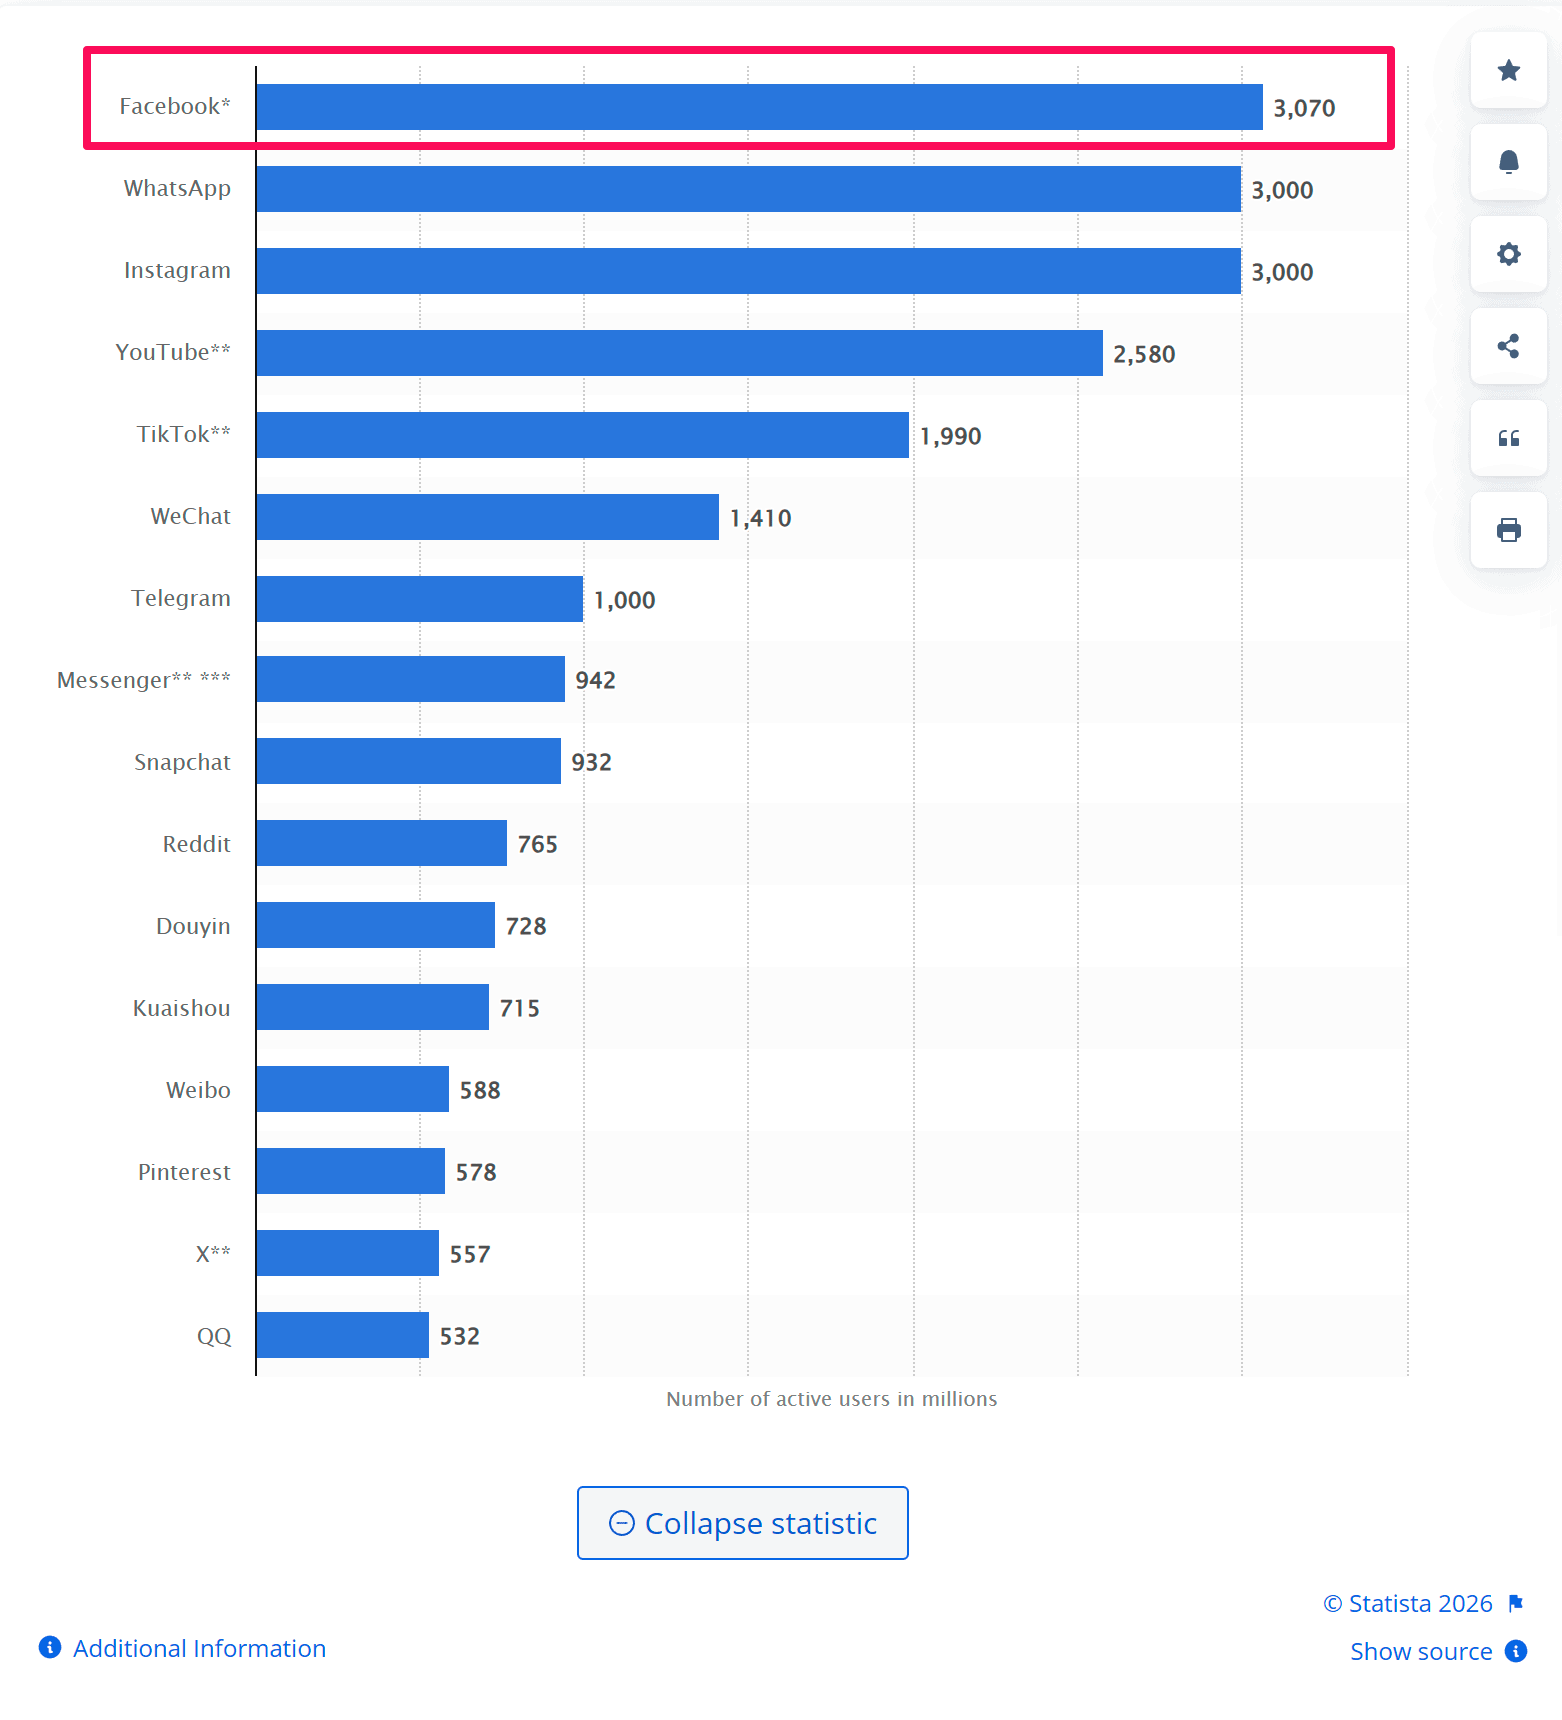
That’s about 36% of the world’s entire population that log in and use Facebook at least once a month.
When you break it down by internet users, it’s even more:
- 58.8% of the world’s total internet users use Facebook every month.
- Over 66% of all Facebook users log onto the social media site daily.
The bottom line here is – don’t believe everything that you read.
Facebook continues to grow in new users and maintain strong engagement in its current user base.
Overall, Facebook has surpassed 10 billion total global downloads…
| App Store | Downloads | Reviews | Ratings |
|---|---|---|---|
| Google Play Store | 10+ billion | 180 million | 4.5/5 |
| Apple Store | N/A | 25 million | 4.5/5 |
… and is widely appreciated by its users – it is rated 4.5 stars on both the Google Play Store and the Apple App Store.
Facebook Demographics
Facebook has a far bigger male user base than female.

56.7% of Facebook users worldwide are male. This is in direct contrast to only 43.3% of Facebook being female.
| Gender | Facebook Users by Percentage (%) |
|---|---|
| Male | 56.7% |
| Female | 43.3% |
Even more than that, almost 20% of Facebook’s worldwide users are men aged 25-34. This is by far the biggest user demographic on the Facebook platform.
In the United States, women aged 25-34 are the largest and most active group of users on Facebook.
It seems that Facebook still has a solid user base of young adults despite experts predicting they would leave the platform.
India has the most Facebook users worldwide with 349 million monthly active users. This is followed by the US with about 194 million monthly active users.
Facebook Usage
Facebook isn’t only the biggest platform in the world…
It’s also one of the most used.
The average Facebook user spends about 19.6 per month on Facebook every month. This works out to be about 39 minutes per day.

The US dips slightly below this with the average Facebook user in the United States spending about 34.6 minutes per day on the platform.
Facebook has also experienced continuous growth in site traffic. Facebook has grown by 3% year over year and now gets about 25.5 billion visits per month.
That’s about 10,000 visits every single second.

Only 0.7% of users on Facebook are unique to the platform.
Just over 50% of Facebook users also use Twitter/X.
Although the platforms differ in many ways, there are also a lot of fundamental similarities that users enjoy on both social media sites.
Facebook Brands
The Facebook brand alone is valued at $101.6 billion. This is primarily due to the brand recognition they have from billions of people worldwide.
There aren’t many brands that can say that.
But Facebook also benefits other brands and businesses. 66% of Facebook users visit a local business page at least once weekly.
One-third of Facebook’s users made a purchase directly from or on the platform in 2021.
That number is expected to grow significantly over the next few years and will only increase the value of the Facebook brand.
Instagram Statistics
![]() Instagram is the third biggest social media platform in the world by users.
Instagram is the third biggest social media platform in the world by users.
It was purchased by Facebook (now Meta) in 2012 for a record-setting $1 billion. Since then it has exploded in popularity with billions of users worldwide.
Here are the social media user statistics you need to know about Instagram.
Instagram Users
Instagram now has around 3 billion users on the platform.
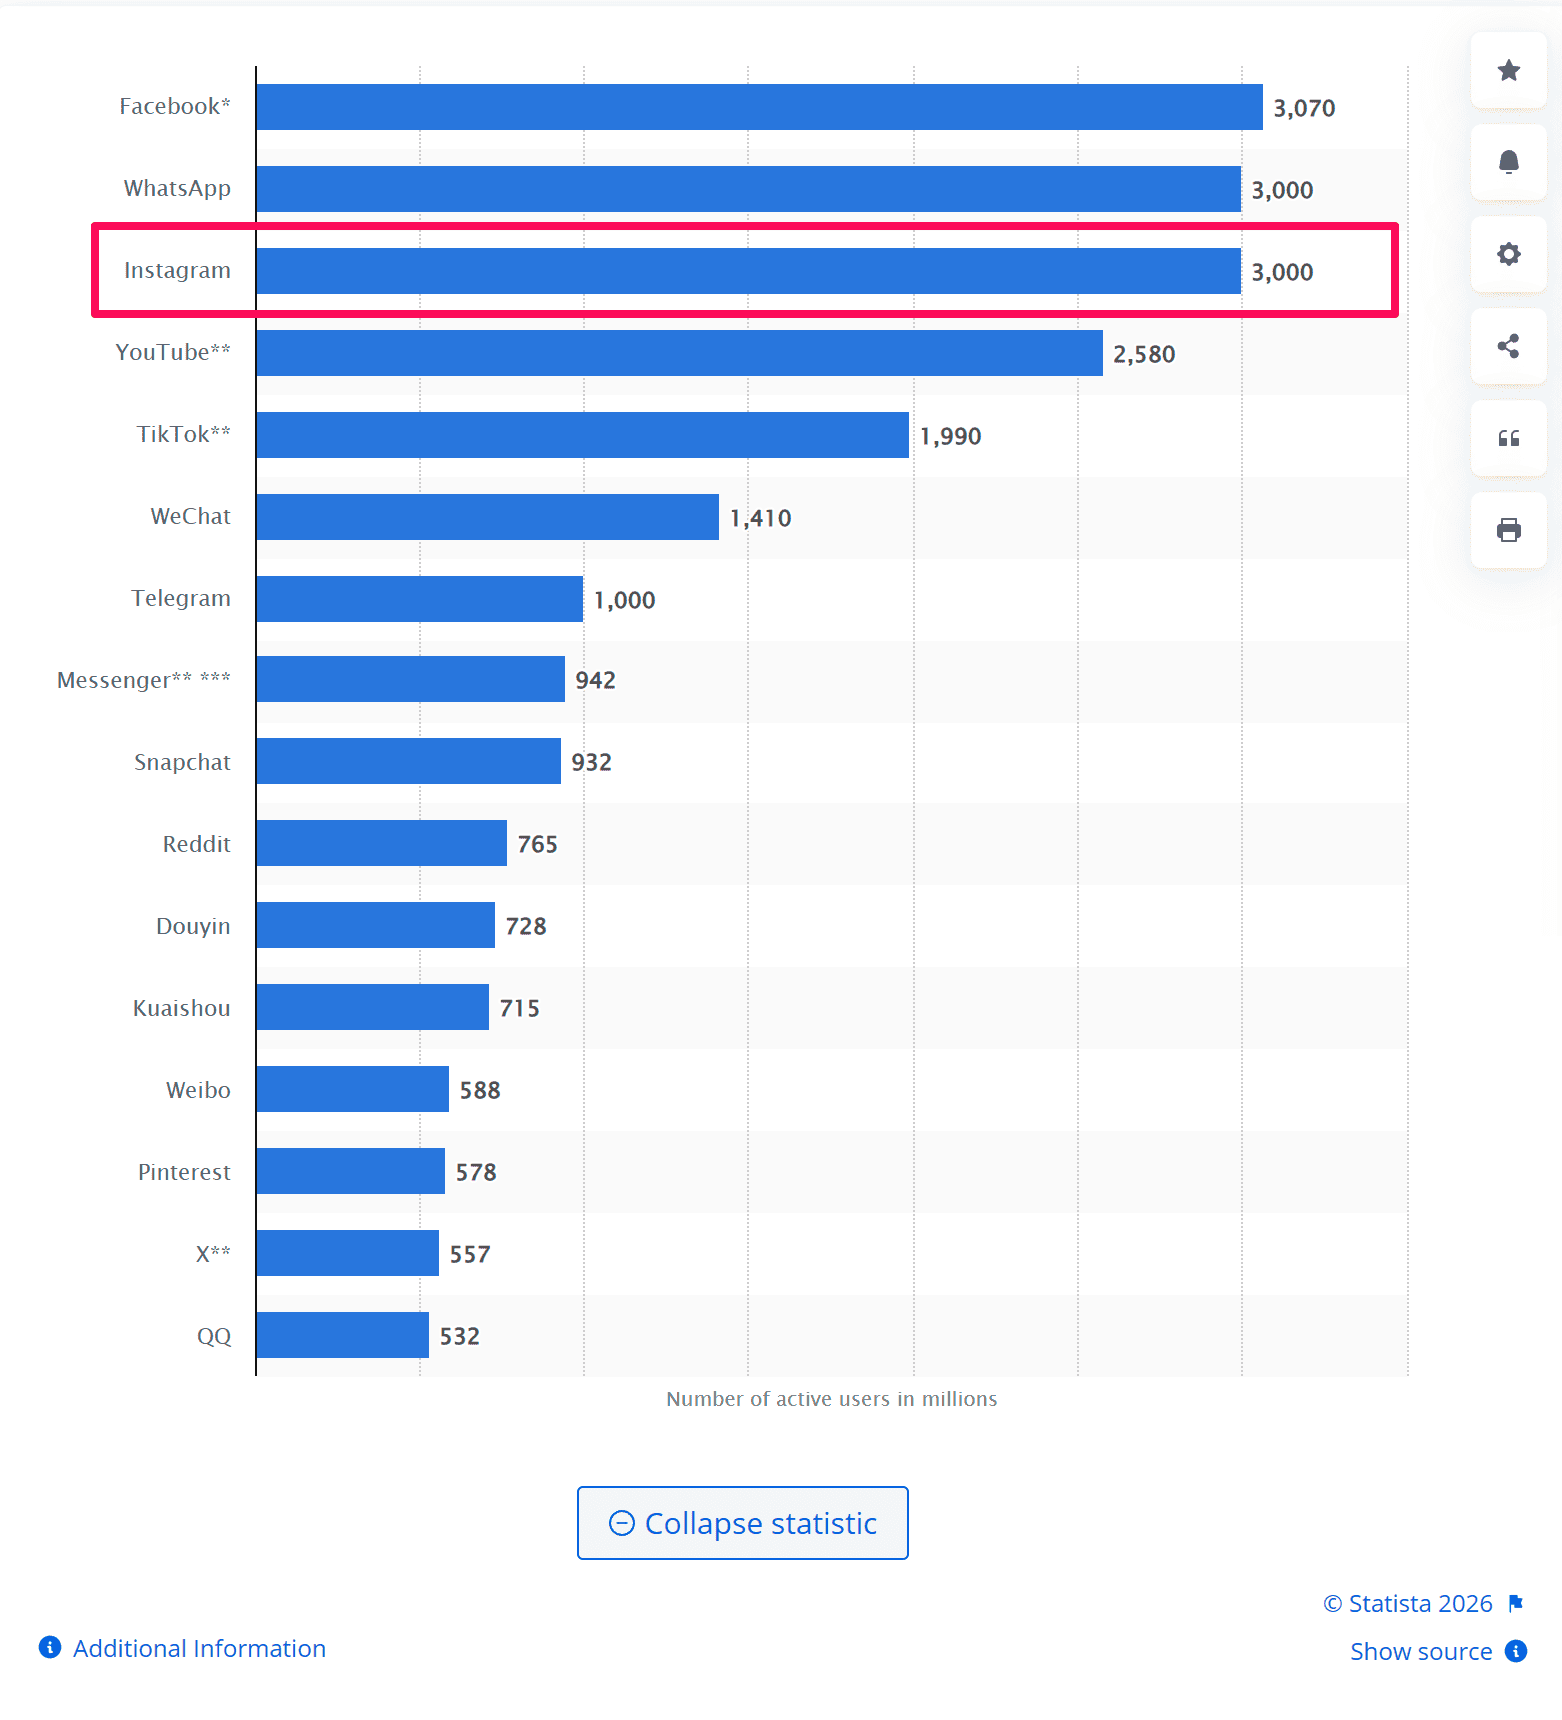
This makes it almost the size of Facebook.
Globally, the Instagram app was downloaded more than 5 billion times.
| App Store | Downloads | Reviews | Ratings |
|---|---|---|---|
| Google Play Store | 5+ billion | 167 million | 4.1/5 |
| Apple Store | N/A | 29 million | 4.7/5 |
What’s more?
The average Instagram user spends about 11.2 hours per month on the platform and approximately 23 minutes per day.
Turkey has the highest monthly usage with Turkish Instagram users spending an average of 20.2 hours per month on the platform.
South Korea has the lowest amount of time spent on the platform with an average of only 5.8 hours per month.
The difference between usage on a country-by-country basis is significant.
Instagram Demographics
Instagram has rapidly evolved over the last 5 years, making tons of changes/updates to the platform.
This has helped them expand their user base while maintaining a loyal following.
The most significant cohorts of users on Instagram are aged 18-24.

Instagram is by far Gen Z’s favourite social media platform and is likely to maintain them as loyal users even as they get older.
What percentage of men and women use Instagram?
Like Facebook, more men use Instagram than Women, but the gap is not nearly as big.
| Gender | Instagram Users by Percentage (%) |
|---|---|
| Male | 50.6% |
| Female | 49.4% |
Men account for 50.6% of Instagram’s audience and women make up 49.4%. You can see that the platform is far more balanced in terms of gender use.

Instagram Usage
Adults are the most engaged audience on Instagram.
59% of US adults use Instagram daily.
Instagram originally started out as the social media platform for images.
It has now evolved into a video-heavy platform. 91% of active Instagram users say they watch videos on the platform on a weekly basis.
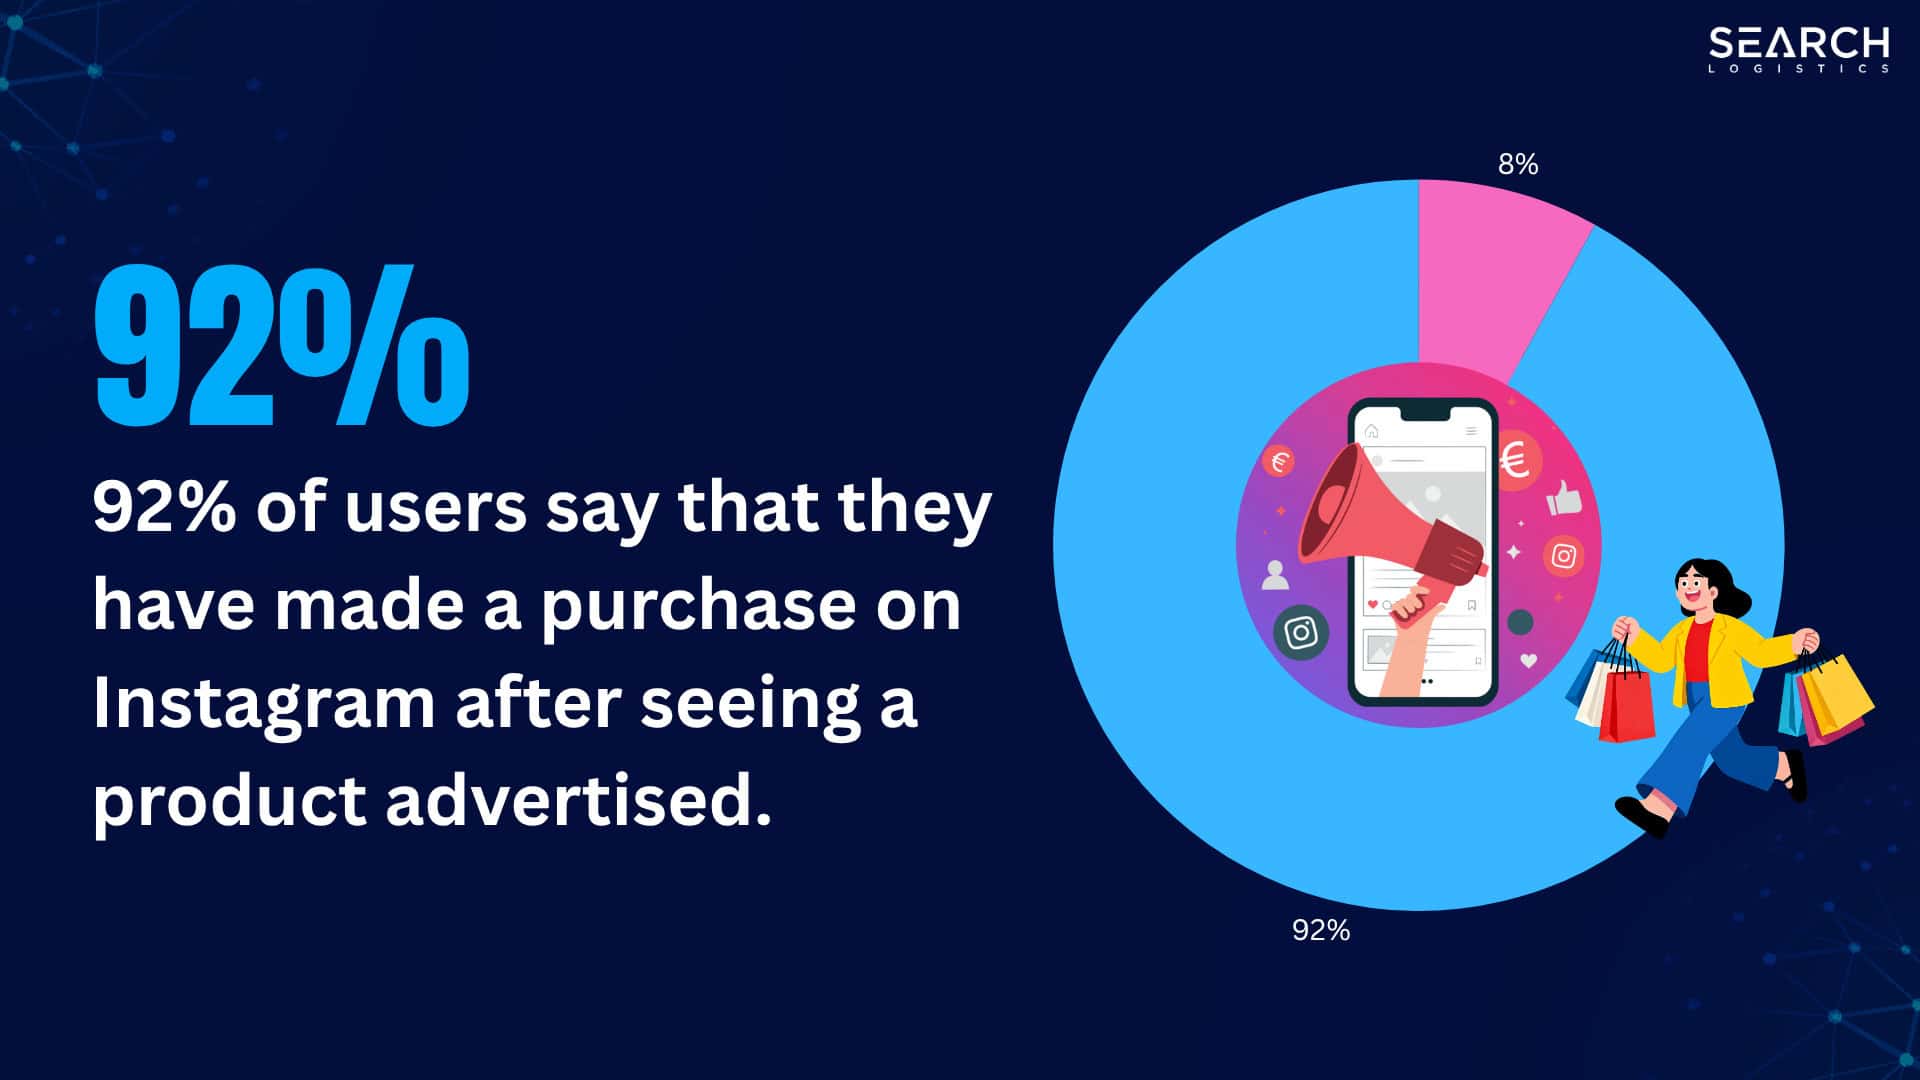
Instagram also drives conversions.
92% of users say that they have made a purchase on Instagram after seeing a product advertised.
There is a strong sense of “social selling” where people on Instagram are happy to be marketed to and engage with ads – particularly video ads.
And Instagram gets a significant amount of reach with ads as well.
Instagram ads reach about 30% of all internet users worldwide. This is good news for business owners looking to expand their current customer base.
Ads are most likely to reach men and women between the ages of 18 to 34. If this is your demographic…
Instagram could be the place to advertise your products and services.
Instagram Brands
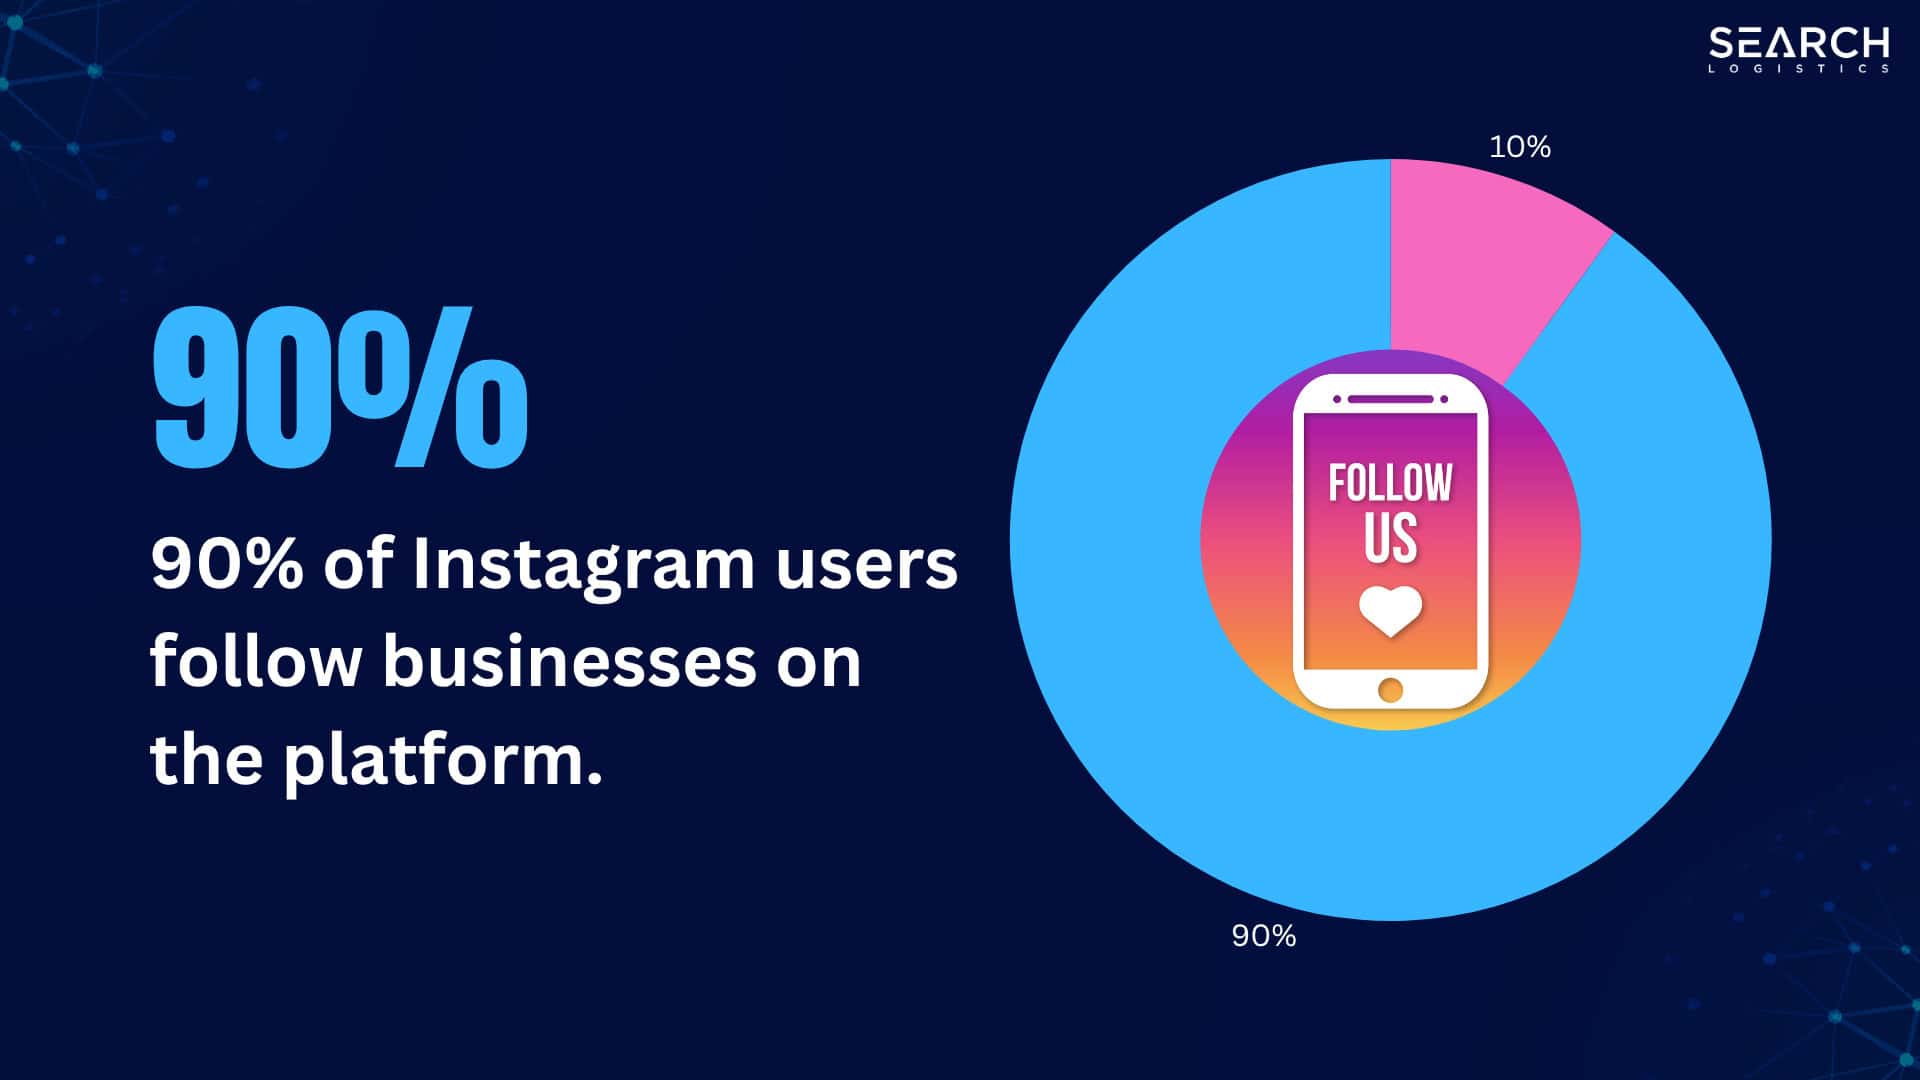
Branding is also incredibly effective on Instagram.
90% of Instagram users follow businesses on the platform.
What’s more?
2 in 3 people say that Instagram helps them positively connect with brands. Part of the reason for this is Instagram Stories.
50% of Instagram users say they’ve clicked through to a brand’s website after seeing one of their Stories.
Stories create an opportunity for brands to communicate more directly with potential customers.
This is why Instagram is working on developing Stories to be more interactive.
50% of people are also more interested in a brand after seeing an ad on Instagram.
These user statistics show that people trust the platform as a way to have more authentic relationships with the brands they love.
X (Formerly Twitter) Statistics
![]() X (formerly Twitter) is a very niche social media platform.
X (formerly Twitter) is a very niche social media platform.
It’s not designed for everyone.
But X/Twitter users love the platform and they are very loyal to it.
Here are all the social media user statistics you need to know about the platform.
Twitter/X Users
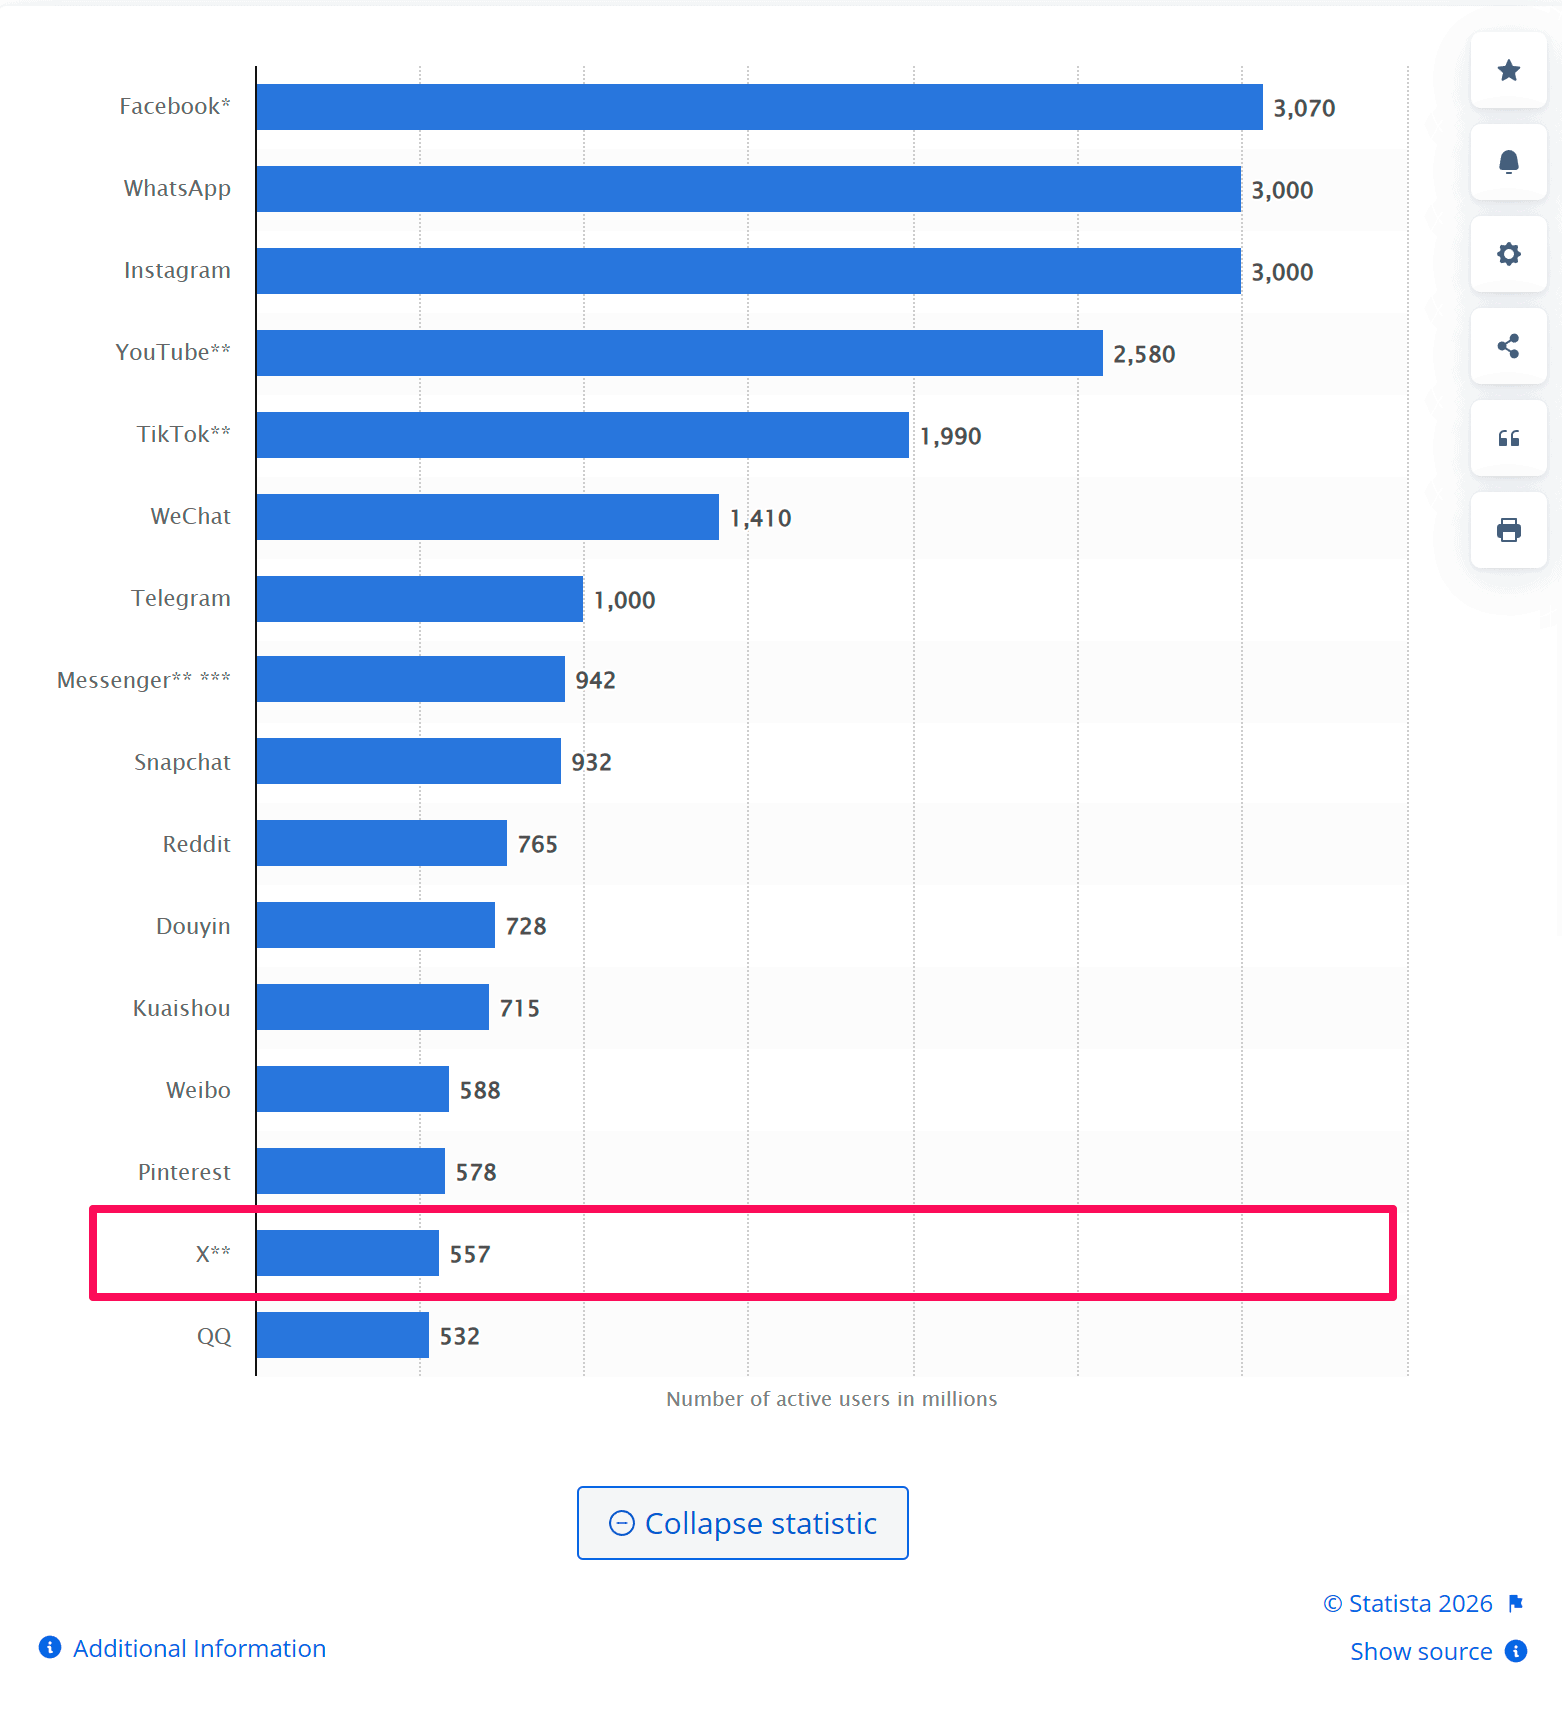
X has now over 500 million monthly active users.
Since its launch, X has been downloaded over 1 billion times, with the majority of those downloads coming from the Google Play Store.
| App Store | Downloads | Reviews | Ratings |
|---|---|---|---|
| Google Play Store | 1+ billion | 22.9 million | 3.4/5 |
| Apple Store | N/A | 11 million | 4.6/5 |
What’s more?
The average Twitter/X user spends 5.1 hours per month on the platform.

This is about half of what most users spend on Instagram and Facebook. It works out to be about 10 minutes per day.
Twitter/X is most popular with millennials and Gen-Z.
The unique platform doesn’t always feel intuitive so it has been harder for Twitter/X to acquire new users quickly.
Looking specifically at the United States – 22% of all Americans use Twitter/X.
Twitter/X is certainly much more popular in the US than in any other country worldwide.
Interestingly Democrats are far more likely to use Twitter/X than Republicans.
Twitter/X Demographics
What’s the main demographic of Twitter users?
36.6% of Twitter/X users are aged 25-34 and make up the biggest age group on the platform. Only 2.4% of Twitter/X users are aged 13-17.

Twitter/X has struggled to compete with other social media platforms with younger social media users.
Most of Twitter/X’s users are actually male.
Here’s the breakdown of users by gender looks like:
| Gender | Twitter/X Users by Percentage (%) |
|---|---|
| Male | 70.4% |
| Female | 29.6% |
You can see that males make up more than ⅔ of all users with 70.4% of the platform being male.
Women account for just 29.6% of Twitter/X’s entire audience.
This is one of the most unbalanced social media platforms in terms of gender.
Twitter/X is where people go to have conversations and catch up on the latest news. Whatever your topic or area of interest, you’ll likely find others to talk with on Twitter.
Twitter/X Usage
The total number of registered Twitter/X users worldwide now exceeds 500 million.
Twitter/X user statistics show a varying degree of how often users login to the platform.
Here’s what it looks like:
| How Often Twitter/X Users Login | Percentage of Users (%) |
|---|---|
| Daily | 52% |
| Weekly | 84% |
| Monthly | 96% |
These stats show that Twitter/X has a very engaged audience.
Most social media platforms measure their user engagement by monthly active users.
In this case, 96% of all Twitter/X users are on the platform at least once per month.
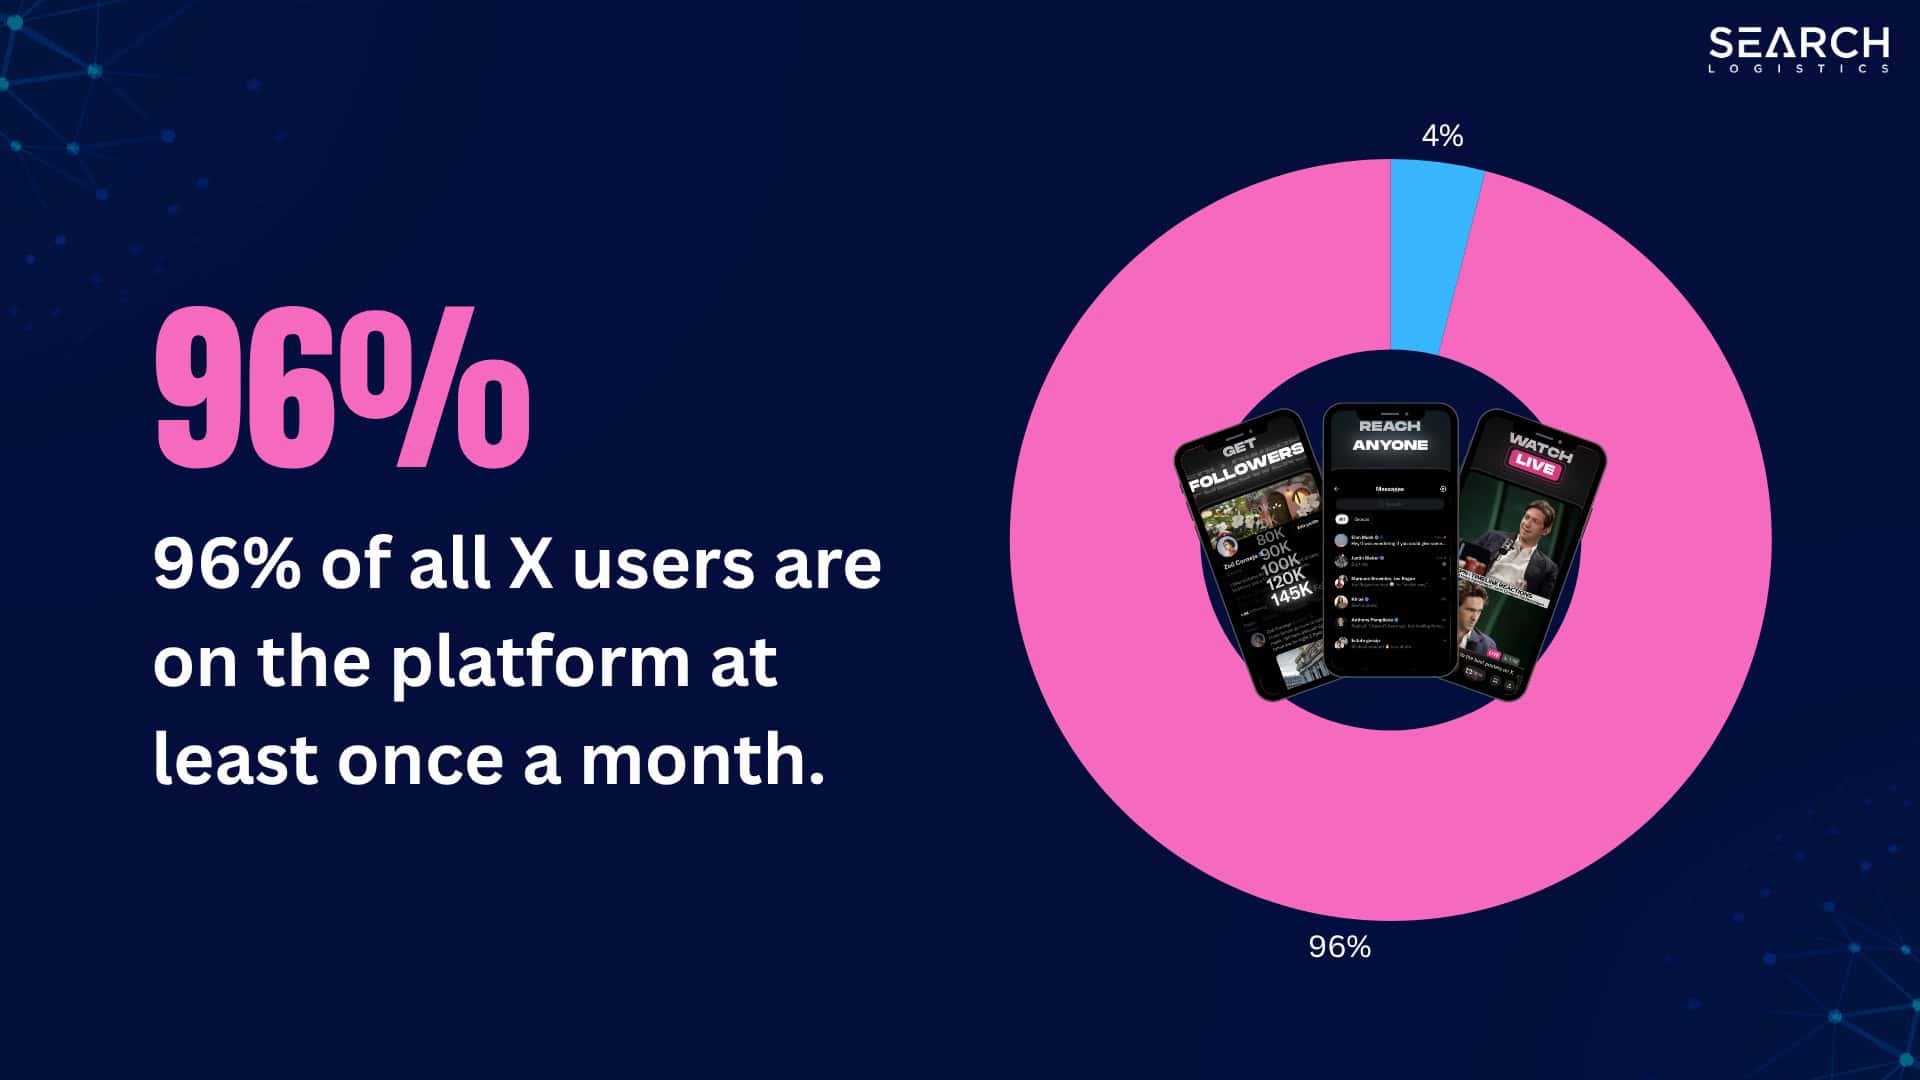
This is a very high number!
Twitter/X Brands
Twitter/X has often come under fire because of their ads platform.
They have not been able to create a powerful ad platform that delivers results like Facebook, Instagram or YouTube.
But not all of this is bad for business on Twitter/X.
In fact, Twitter/X offers good organic reach for brands and posts tend to get far more engagement than other platforms like Facebook.
237 million of Twitter/X’s daily active users can be monetised through ads.
They have the audience available and it’s up to marketers to create better advertisements.
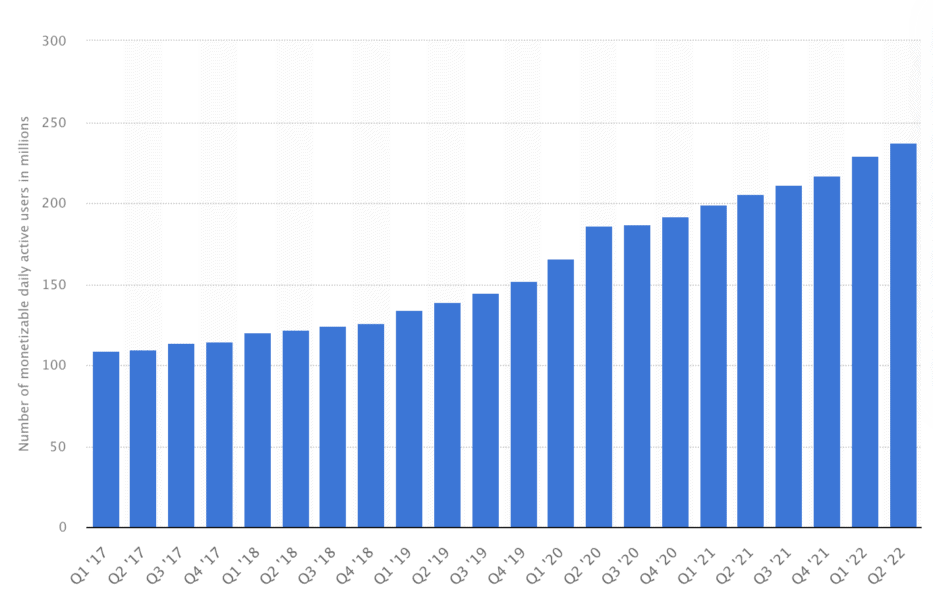
You can’t just rely on the algorithm to do it for you.
X (formerly Twitter) generated approximately $2.5 billion to $2.7 billion in total revenue in 2024, representing a significant decline from pre-acquisition levels, with roughly 68% of that revenue coming from advertising.
Advertising revenue on Twitter/X exceeded $2 billion in 2025. This was an annual increase of 22% year over year.
Twitter/X has started to work more on its advertising platform and algorithm to generate more revenue for the company.
YouTube Statistics
![]() YouTube is the fourth most popular social media site behind Facebook, WhatsApp and Instagram.
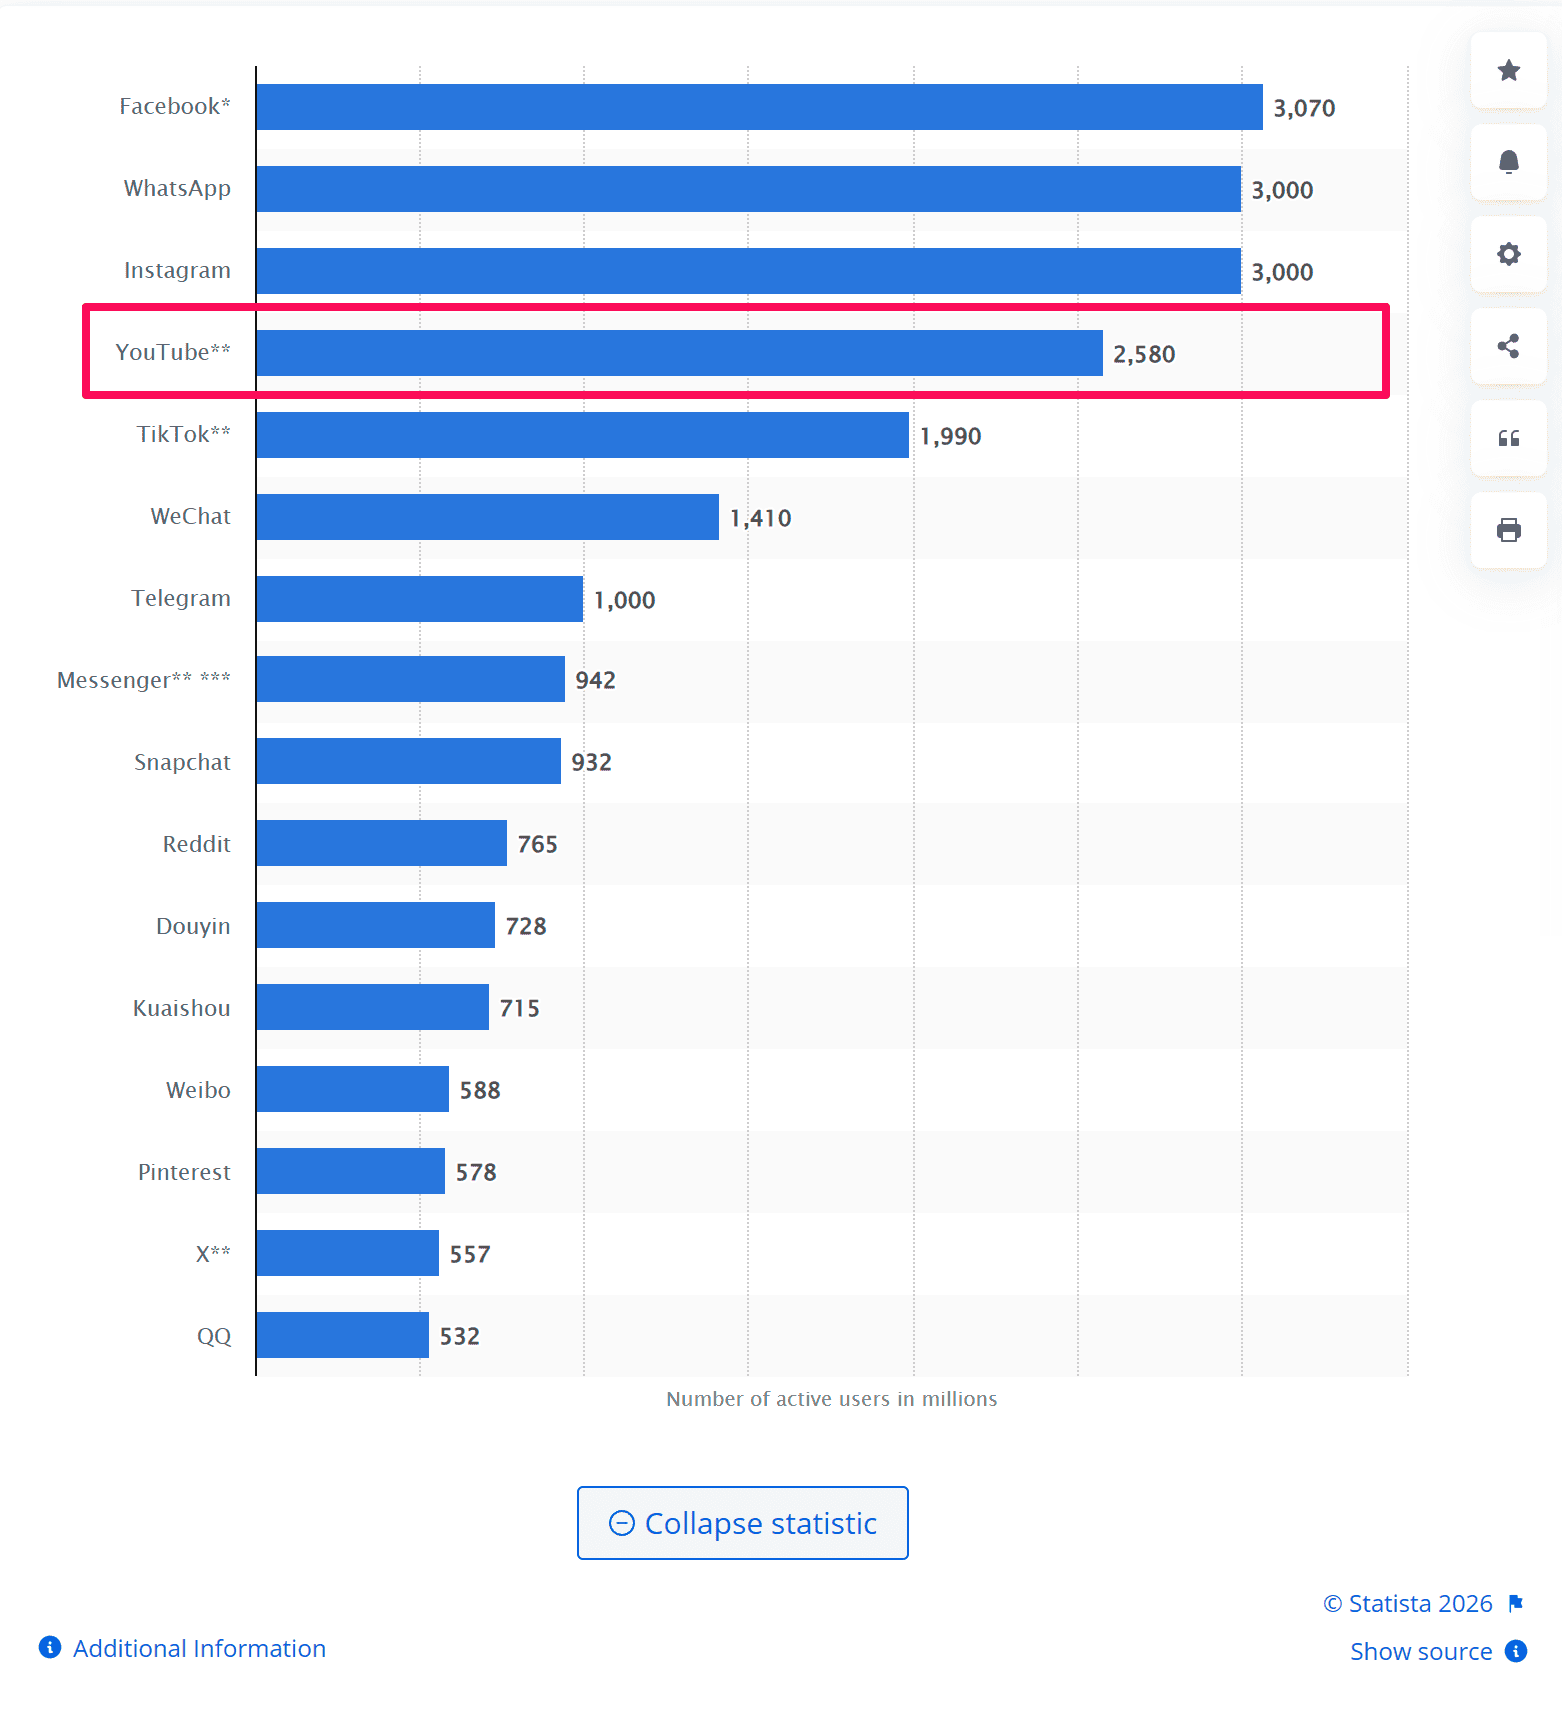
YouTube is the fourth most popular social media site behind Facebook, WhatsApp and Instagram.
But YouTube is also considered a search engine.
In fact, YouTube is viewed as the second biggest search engine behind Google. It has become a powerhouse platform with billions of loyal users.

Here are the latest social media user statistics from YouTube.
YouTube Users
YouTube has over 2.5 billion monthly active users.
In total, YouTube has been downloaded over 10 billion times, with the majority coming from the Google Play Store.
| App Store | Downloads | Reviews | Ratings |
|---|---|---|---|
| Google Play Store | 10+ billion | 169 million | 3.8/5 |
| Apple Store | N/A | 46 million | 4.7/5 |
Although YouTube is not the largest social media site, it gets the most use.
The platform boasts an average of 23.7 hours per month spent by users.

This means people spend the most time on YouTube monthly compared to any other social networking channel.
YouTube has cemented itself as “THE” video platform.
A massive 81% of Americans use YouTube regularly. 39% of American adults say that they visit YouTube several times per day.
While most social platforms are happy if they can get people to use their site daily – YouTube gets its audience using the platform multiple times daily!
Some experts even predict that YouTube is only just getting started. Younger generations have started watching YouTube instead of watching TV.

There is a large possibility that YouTube could fully replace TV in the future.
99% of YouTube users regularly use another social media platform.
So while YouTube will continue to dominate the video space, it is not a stand-alone social platform for users.
YouTube Demographics
Who are the biggest consumers of YouTube?
Short answer – Children.
80% of parents say that their children under the age of 11 watch YouTube regularly. The point here is YouTube attracts a lot of very young users which is not common on other social channels.
| Gender | YouTube Users by Percentage (%) |
|---|---|
| Male | 54% |
| Female | 46% |
YouTube has a reasonably balanced user base of both genders with a slight majority of male users. 54% of YouTube users are male and 46% are female.
India has the most YouTube users with 491 million monthly active users. This is followed by the United States at 253 million monthly active users.

YouTube Usage
Now you know that YouTube is the world’s second most-used social media platform.
But how many visits does the site get?
YouTube gets an average of 14.3 billion total worldwide visits every month.

In other words, it attracts about 1.7 billion unique monthly visitors. That means the average user visits YouTube about 8 to 9 times monthly.
Visitors spend an average of 19 minutes a day on YouTube.
Even more than that…
694,000 hours of video content is streamed on YouTube every minute. That means about 1 billion hours of content is streamed daily on YouTube.

That’s a lot of content being consumed.
The mobile app has become very important for YouTube and its users. Mobile users visit 2x as many pages as desktop users.
The social media platform has realised that it is easier to keep users engaged on their mobile application than if they are on a desktop.
Sports viewership is one of the latest trends on YouTube. Around 90 million people will watch live sports regularly on YouTube by 2025.
YouTube Shorts have also become a big part of the platform to compete with TikTok and Instagram. And it might be working.
YouTube shorts have now been viewed over 5 trillion times.
This has helped continue to ensure that YouTube is the ultimate video social media platform.
Youtube Brands
YouTube is a great place to promote your brand.
It works for almost any niche and allows you to connect with customers in a different kind of way.
70% of YouTube viewers bought from a brand after seeing it on YouTube.
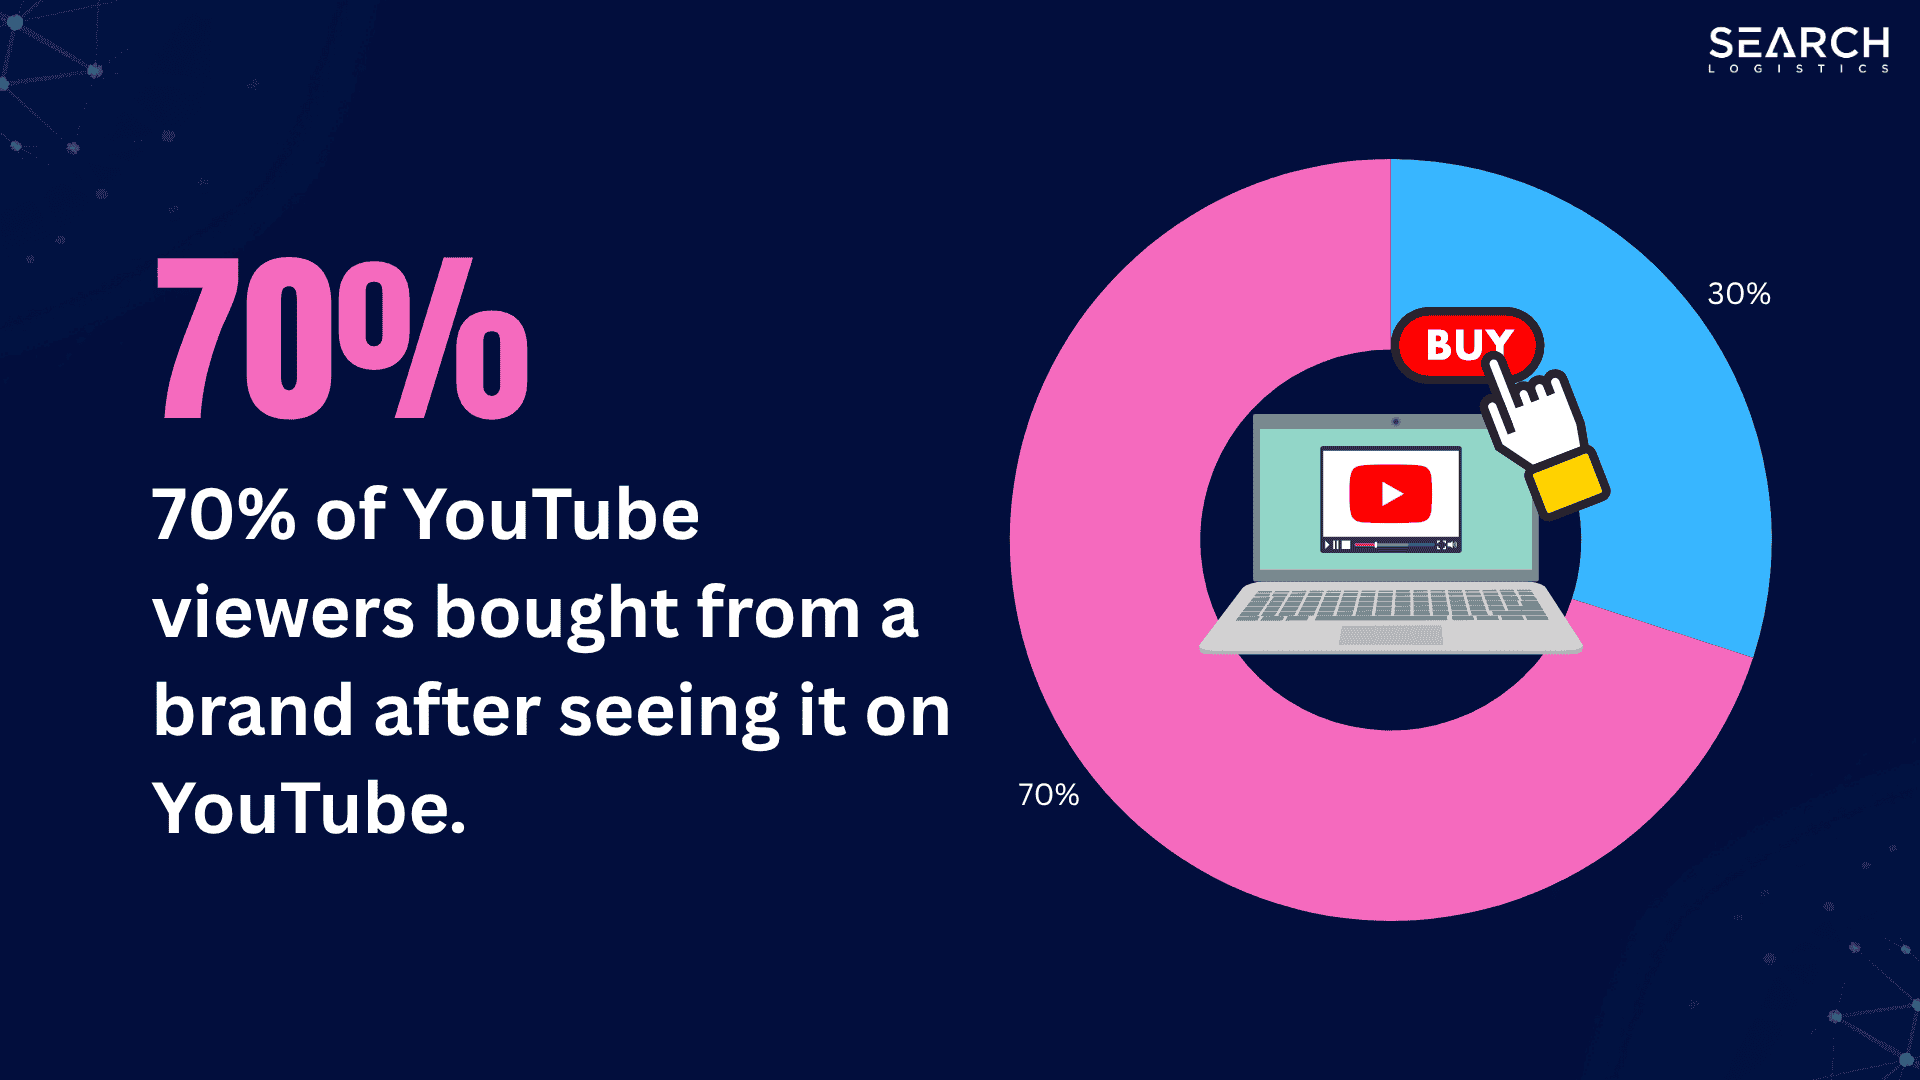
For D2C brands, there is a big opportunity to grow your audience and sales with YouTube.
The YouTube ads platform is also among the most powerful of all social media channels.
Ads can be targeted to users by intent rather than just:
- Demographic
- Interest
This means that the YouTube ads algorithm can determine who will likely buy and show ads to those people.
Marketers using user intent on the platform have seen a 100% higher lift in purchase intent than when using demographic and interest targeting.
YouTube ads have the potential to reach 2.56 billion monetisable users.
LinkedIn Statistics
![]() Most people don’t realise that LinkedIn is actually one of the oldest social media sites still around today.
Most people don’t realise that LinkedIn is actually one of the oldest social media sites still around today.
LinkedIn was founded in 2002 and officially launched in 2003. It wasn’t until 2010 that LinkedIn started to become popular, reaching 70 million active users.
Today LinkedIn is one of the world’s most popular social media platforms.
And experts predict that their social media growth is just getting started.
LinkedIn Users
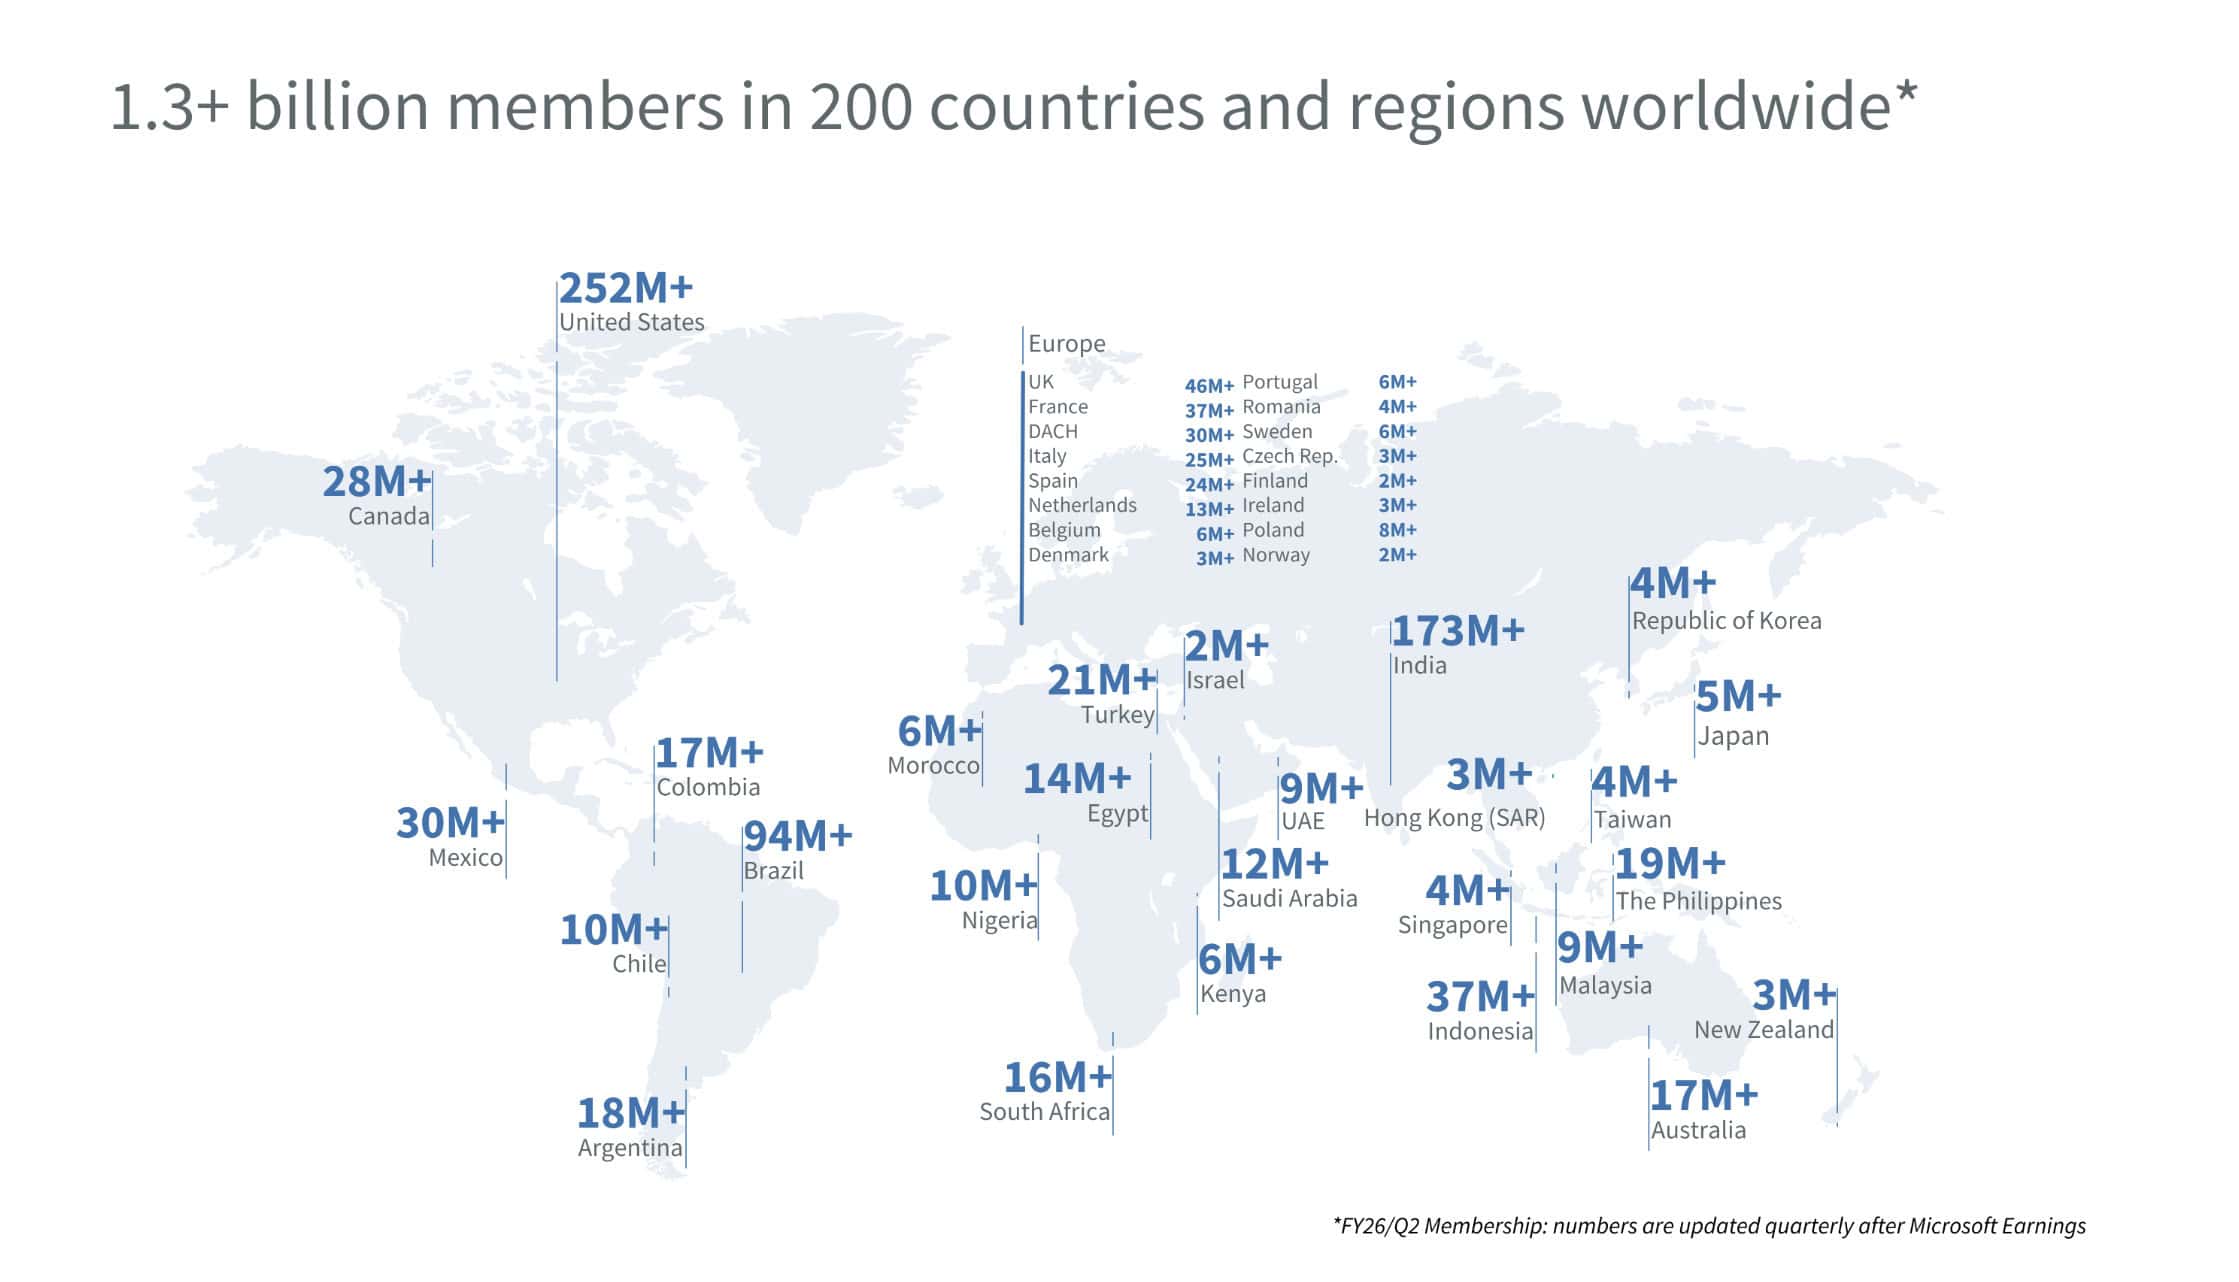
LinkedIn now has over 1.3 billion users worldwide and has been downloaded over 1 billion times on the Google Play Store alone.
| App Store | Downloads | Reviews | Ratings |
|---|---|---|---|
| Google Play Store | 1+ billion | 3.4 million | 4/5 |
| Apple Store | N/A | 629,000+ | 4.8/5 |
Over 250 million people in the US use LinkedIn, which represents about 25% of all LinkedIn users.
What’s more?
LinkedIn has cemented itself as a juggernaut in the social media world.
It’s also the most popular professional network available and is used by millions of companies globally for recruitment.
LinkedIn Demographics
The United States is the biggest user of LinkedIn.
Over 250 million Americans used LinkedIn, meaning about 57% of all Americans have a LinkedIn profile or have used the platform in some capacity.
Hungary has the lowest LinkedIn usage rates of any country worldwide. Only 1 million Hungarians are on the platform.
Which gender uses LinkedIn the most?
There are more male LinkedIn users than females – although it is pretty balanced:
| Gender | LinkedIn Users by Percentage (%) |
|---|---|
| Male | 52.1% |
| Female | 47.9% |
52.1% of all LinkedIn users are male and 47.9% are female. This is pretty balanced when you compare LinkedIn with other platforms.
Not only that, but…
- LinkedIn is most popular with men aged 25-34 years old.
- LinkedIn is least popular with women aged 55+.

LinkedIn Usage
LinkedIn is a professional social media site.
That means a big part of the platform is based on recruitment (for businesses) and sharing professional content (for job hunters).
To put that in perceptive…
- A massive 77 jobs are submitted through LinkedIn every second.
- More than 6.6 million people apply for jobs every day on LinkedIn.
And that’s just the beginning…
52 million people use LinkedIn every week to search for new jobs.
LinkedIn has become one of the biggest hubs for both job seekers and recruiters.

The LinkedIn app is also popular with users.
Just over 16% of users on LinkedIn log into the app daily. 48.5% of users log in to the app at least once per month.
Although these numbers are lower than other social media platforms, it’s still a significant portion of people.
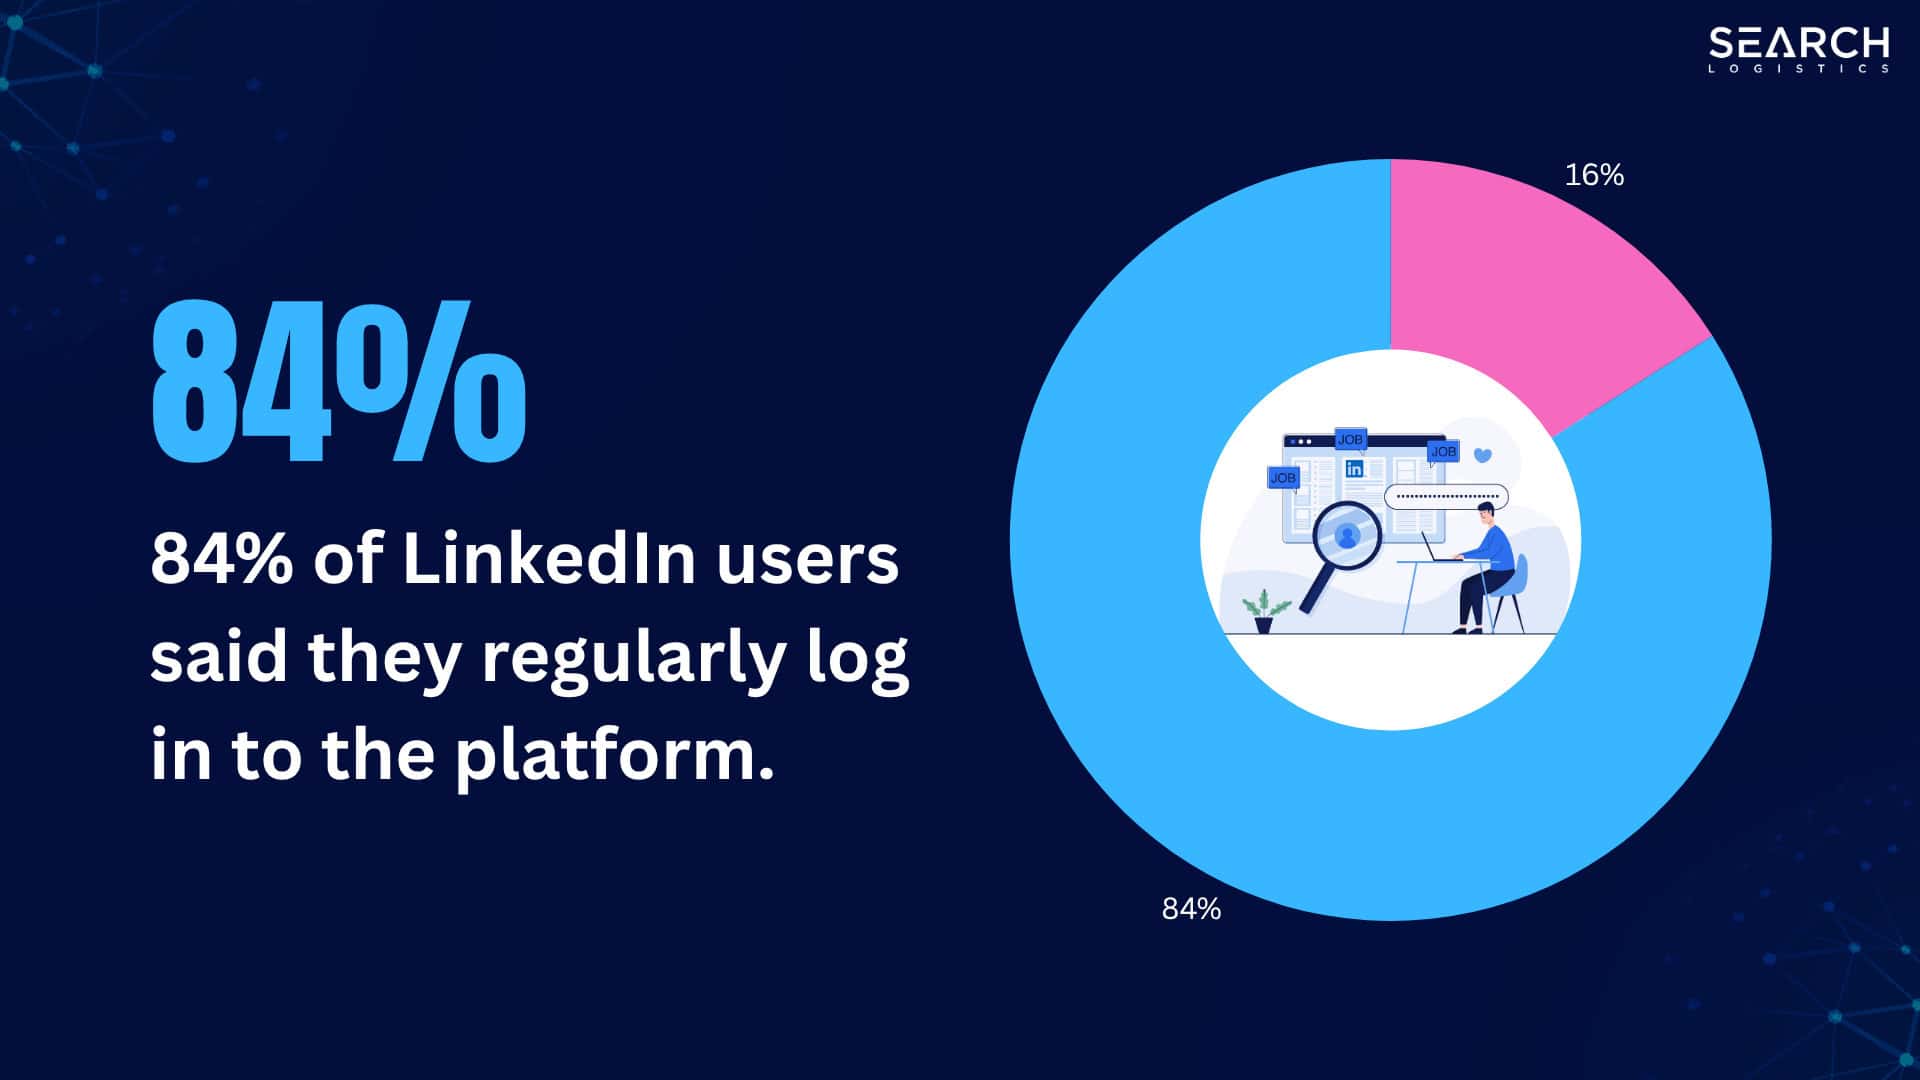
But the number 1 reason people use LinkedIn is to increase their network.
84% of LinkedIn users said they regularly log in to the platform to grow their professional network.
LinkedIn Brands
If LinkedIn is a professional social media network, it makes sense that it is used by brands.
The most-followed brands on LinkedIn are:
- 1. Google
- 2. Amazon
- 3. TED Conferences
- 4. Forbes
- 5. Unilever
- 6. Microsoft
Linked has over 57 million companies that are listed on the site with pages for their brand. LinkedIn has also become a popular place for advertisers.
The biggest benefit of LinkedIn is that you can target by job title.
This means you can:
- Reach a very specific audience.
- Tailor your marketing message.
LinkedIn ads reach just over 10% of the entire world’s population, making it a great place to put your products or services in front of the right people.

Snapchat Statistics
 Snapchat was released in July 2011.
It quickly grew in popularity especially among younger teens.
Snapchat was so popular that Facebook tried to buy Snapchat in 2013 for $3 billion which they declined.
Since then, Snapchat has become one of the most popular social media sites today.
Here are the latest social media user statistics on Snapchat.
Snapchat Users
How many users does Snapchat have?
Snapchat now boasts over 319 million daily active users and about 800 million monthly active users worldwide.
That means it’s one of the most engaging platforms.

Globally, the Snapchat app was downloaded over 1 billion times on the Google Play Store.
| App Store | Downloads | Reviews | Ratings |
|---|---|---|---|
| Google Play Store | 1+ billion | 39.2 million | 4.3/5 |
| Apple Store | N/A | 4.7 million | 4.5/5 |
But what’s more impressive is the growth.
Snapchat has had a considerable growth rate of about 20% daily active users over the last five consecutive quarters.
This is impressive for a social media platform that’s more than 10 years old.
23% of US adults use Snapchat, which is more than both Twitter/X and TikTok.
These stats combined with Snapchat’s growth, show that the social media platform is not done growing yet.
Snapchat Demographics
What are the main demographics of Snapchat?
Simple – Millennials and Gen Z.
Snapchat reaches 75% of millennials and Gen Z:
- 121 million Snapchat users are aged 13 to 17.
- 232.2 million users are aged 18 to 24.
The most popular age group for Snapchat is 18 to 24 by far, making up about 37.6% of their total user base.

Snapchat Usage
Very few Snapchat fans use the platform exclusively.
Because Snapchat is more of a messaging service combined with videos and images, people don’t spend all their time on Snapchat.
It’s a quick check and reply to friends before leaving the platform again.
The average Snapchat user spends just 3 hours per month on the app.
This works out to be 6 minutes daily and is far less than the other big social media networks.

But Snapchat is working on keeping its users engaged for longer.
People will spend an average of 7 minutes per day on Snapchat this year.
Snapchat launched 18 New Year’s Eve lenses for 2022, generating more than 7 billion impressions.
Snapchat Brands
Advertising on Snapchat is very different from other platforms.
But Snapchat has been successfully developing its ads platform to better help advertisers. Snapchat’s revenue increased by 64% in 2021, with the social media network generating $4.1 billion in revenue.
That’s a big jump!
The minimum daily budget on Snapchat is just $5, which allows even smaller businesses to advertise.

25 of Snapchat’s Discover Partners reached over 50 million unique Snapchatters worldwide.
Discover is a specific part of the app where you can find the latest news and content from big publishers.
Is it worth advertising on Snapchat?
It’s estimated that Snapchat users hold about $4.4 trillion in spending power.
So if you can combine the right ad with the right kind of products or service, there is definitely money to be made from Snapchat.
In 2021, cosmetics giant MAC built several augmented-reality try-on makeup lenses and launched these on their channel. The results were impressive:
- 1.3 million try-ons
- 2.4x lift in brand awareness
- 17x increase in purchases
The key for brands on Snapchat is being relevant to the age groups on the platform and creating content that engages them.
TikTok Statistics
![]() TikTok is the latest social media network to make it big, with over 1.5 billion monthly active users.
TikTok is the latest social media network to make it big, with over 1.5 billion monthly active users.
It was released in September 2016 and has become a powerhouse platform growing faster than any other platform in history.
As of 2026, Tiktok is the 5th most popular social media plateform by number of monthly active users.
The truth is…
TikTok looks like they are just getting started.
TikTok Users
TikTok has about 1.5 billion monthly active users worlwide.
Overall, TikTok has surpassed 5 billion total global downloads, with approximately 495 million of those coming from the Apple App Store.
TikTok is widely appreciated by its users – it is rated 3.9 stars on the Google Play Store and 4.7 stars on the Apple App Store.
| App Store | Downloads | Reviews | Ratings |
|---|---|---|---|
| Google Play Store | 4.5+ billion | 68.5 million | 3.9/5 |
| Apple Store | 495 million | 18+ million | 4.7/5 |
What’s more?
TikTok user statistics show that TikTok has the second highest usage of any platform.
Users spend an average of 19.6 hours per month on TikTok alone. This works out to be approximately 39 minutes per day.

That’s almost double what Facebook gets!
TikTok Demographics
Who uses TikTok?
TikTok is very popular in the United States with 20% of US adults using the platform.
The vast majority of TikTok users are below 30 years old. Approximately 37 million Gen-Zers used TikTok in the US.
But TikTok also has a big difference between men and women on the platform:
| Gender | TikTok Users by Percentage (%) |
|---|---|
| Male | 61% |
| Female | 39% |
61% of TikTok’s user base are female and just 39% are male.
Teenagers between the ages of 10 – 19 also account for 16.4% of TikTok’s users.
The bottom line is that most TikTokers are women under the age of 30.
American adults also love TikTok with 36% of US adults saying that they hold a favourable opinion about the app compared to other social media applications.
TikTok Usage
TikTok comes in 5th position in a list of the world’s most-used social media sites today.

That’s impressive for a network that was launched in 2016.
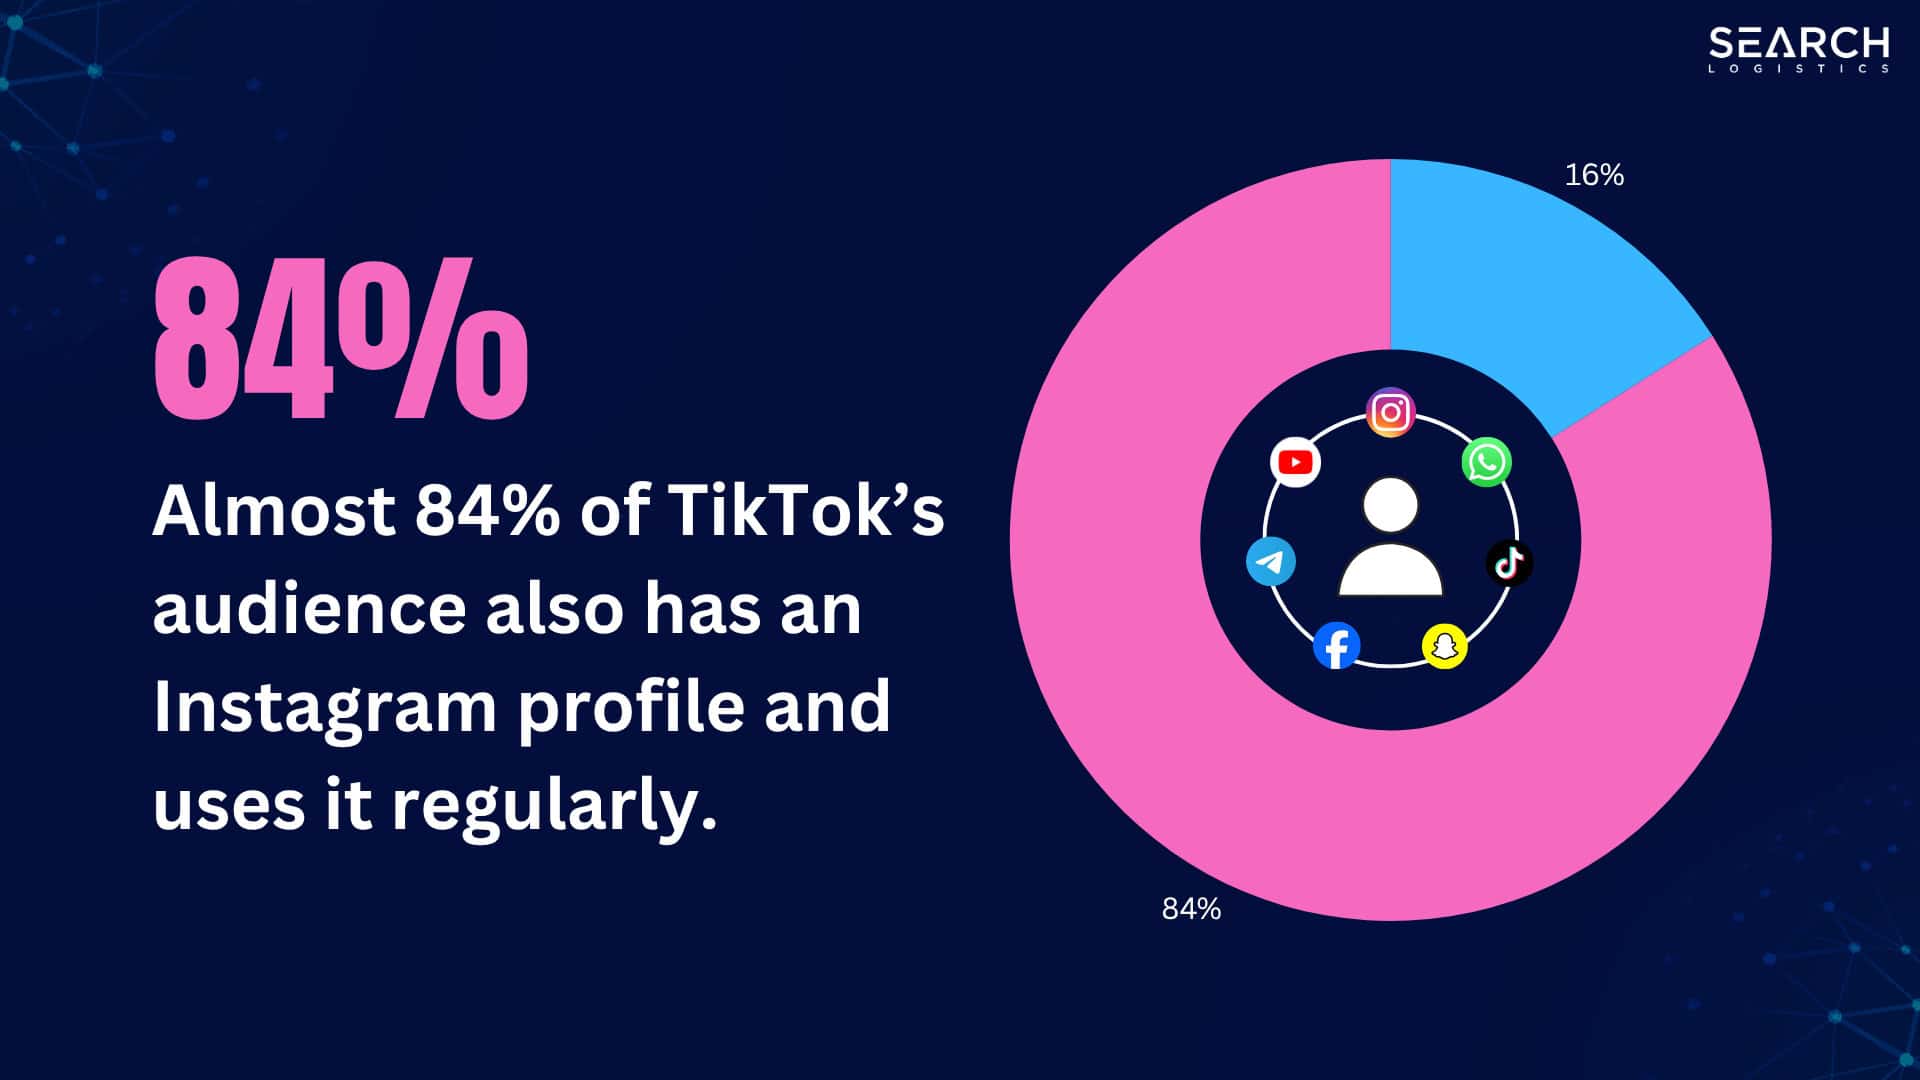
TikTok users have high similarities to Instagram. Almost 84% of TikTok’s audience also have an Instagram profile and use it regularly.
Instagram has been accused of copying TikTok with its “Reels” feature.
It is very similar to TikTok and was developed when Meta realised how popular the platform was becoming.
TikTok is also seen as a more “positive” social media platform. 57% of TikTok’s mentions around the internet are considered positive.
TikTok Brands
TikTok has paved the way for new brands to be created.
Most of the popular brands on TikTok are personal brands:
- The most popular TikTok account is Khaby Lame with over 161.5 million TikTok followers.
- The most followed company is actually TikTok’s own account with 64.9 million followers.
TikTok has slowly been developing its advertising platform.
Although it’s not quite as powerful as the big platforms like Facebook and YouTube, there is a lot of buzz around it.
63% of TikTok ads with the highest CTR put their message straight upfront.
Vertical TikTok videos have a 25% higher watch-through rate.
Video ads need to be adapted to the platform to maximise results.
Social Media Negative Side Effects
There is no doubt that social media is used by almost everyone.
But is social media actually good for us?
The truth is that social media is addictive.
Social media addiction statistics show that over 210 million people worldwide suffer from social media addiction.

There are currently 5.66 billion social media users globally, meaning about 4.69% of total users are addicted.
And it’s even worse for younger people:
- 40.6% of young people complain that social media significantly affects their sleep.
- 34% of young adults said that not being on social media causes them to feel like they’re missing out on something (aka FOMO).
A further 43% of young people feel very bad if no one likes or engages with their social media posts.
Social media has a lot of benefits, but it also has its downsides. Those downsides have very negative side effects on millions of people worldwide.
Want to learn more about how social media affects you?
Check out my complete social media addiction statistics post.
Wrapping It Up
Social media is a big part of our lives now and in the future.
The above social media statistics show that it’s even increasing as new platforms are developed. Just look at the rapid rise of TikTok.
It’s also clear that there is no one social media platform that rules them all.
People today have and use multiple social media accounts to connect with family and friends while staying up to date with the latest news.
This isn’t likely to change in the future, either.
Now I want to hear from you:
Want more statistics posts? Take a look at these blogs:
You Might Also Like


What Are Your Thoughts?
One Response


Great insights on social media usage! It’s fascinating to see how these numbers evolve over time. I particularly found the breakdown of the most popular platforms interesting. It really highlights where businesses should focus their efforts. Keep up the good work!