


Most people think that Netflix is a relatively new company.
But the truth is that Netflix was founded back in 1997 and physically shipped DVDs and videos to its subscribers by mail.
By 2001 Netflix had more than 500,000 subscribers in their mail service.
Today Netflix is the giant in the online streaming world.
In 2007, Netflix developed the online platform you are most familiar with today – streaming movies, TV shows and more all over the world.
Netflix paved the way for a new industry that has taken the world by storm.
But is Netflix still as popular today as it once was?
These Netflix statistics tell the whole story of how many users Netflix has and how they perform against the growing competition.
What Will I Learn?
Key Netflix Statistics
![]() Netflix definitely had the first-mover advantage in online streaming.
Netflix definitely had the first-mover advantage in online streaming.
But being first isn’t always the best.
Netflix has been met with tons of competition from major multinational companies. These are the key Netflix Statistics you need to know:
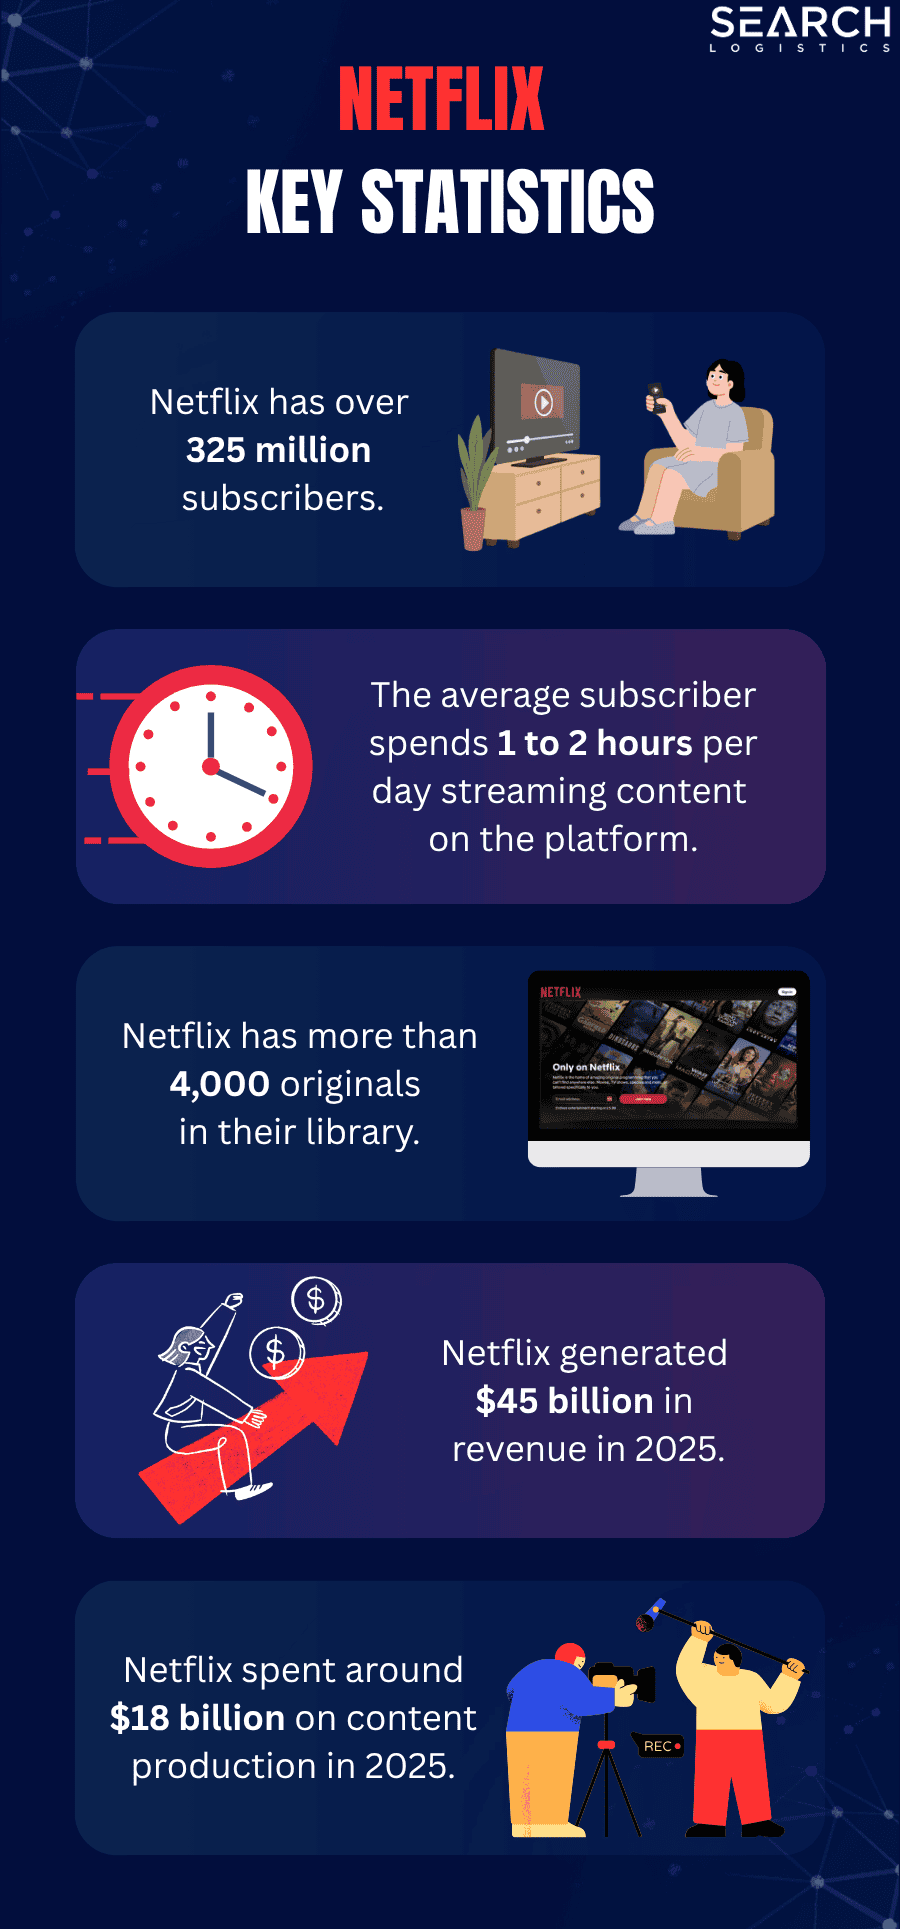
- Netflix has over 325 million subscribers worldwide.
- Netflix generated a massive revenue of $45 billion in 2025.
- Most Netflix subscribers are based in the EMEA region (Europe, Middle East, and Africa), accounting for around 101 million of Netflix’s total global subscriber base.
- The average subscriber spends 1 to 2 hours per day streaming content on the platform.
- Netflix users spend an average of 18 minutes just browsing before choosing a show.
- Netflix has more than 4,000 originals in their library.
- The average Netflix user has consumed over 49 days‘ worth of content since creating an account.
Now that you have some of the key Netflix statistics, let’s dive deeper.
Netflix Global Subscribers
Global subscribers are one of the most important metrics for Netflix investors.
It tells you whether the platform is-
- Growing
- Decreasing
- Or stagnant.
The number of active worldwide Netflix subscribers is 325 million as of the first quarter of 2026.
Here is the full breakdown of Netflix global subscribers by year since 2013:
| Year | Netflix Subscribers |
|---|---|
| 2013 | 41.43 million |
| 2014 | 54.48 million |
| 2015 | 70.84 million |
| 2016 | 89.09 million |
| 2017 | 110.64 million |
| 2018 | 139.26 million |
| 2019 | 167.09 million |
| 2020 | 203.66 million |
| 2021 | 221.84 million |
| 2022 | 221.64 million |
| 2023 | 260 million |
| 2024 | 300 million |
| 2025 | 325 million |
As you can see, Netflix has had a consistent growth until 2021.
In the last quarter of 2021, the number of Netflix subscribers was 221.84 million.
Netflix executives released a report at the end of the first quarter of 2022 detailing that the platform lost 200,000 subscribers over the 3-month period.
The day after the report was released, Netflix stock plunged by over 35%.
This was the single biggest drop in the history of the company.
It was the first time that investors realised that Netflix had serious competition in the streaming market.
Being the oldest and most established online streaming platform isn’t enough to hold subscribers.
It’s all about the content.
But it didn’t stop there.
At the end of the second quarter of 2022, Netflix had 220.67 million subscribers.

Overall, 2022 wasn’t a good year for Netflix.
However, 2023 was much better since Netflix managed to get more subscribers than they lost the previous year.
They ended 2023 with about 260 million subscribers, which is an increase of almost 39 million paying subscribers.
Netflix recorded over 300 million paid subscribers worldwide as of the fourth quarter of 2024.
Netflix ended 2025 with approximately 325 million subscribers, which means that they gained 25 million subscribers that same year.
Despite that:
Netflix is facing a huge problem:
About 41% of all Netflix users access the platform without paying.
How?
By using someone else’s account:
- About 14% of users watch on the Netflix accounts of their friends or family.
- About 27% of users watch using the paid subscription of someone in their household.
Put simply – More than 4 out of 10 Netflix users aren’t monetisable.
This is a huge risk for Netflix now and in the future.
Netflix Subscribers Per Region
Which are the biggest subscriber regions for Netflix?
In 2022, a Netflix report showed that about 75 million of Netflix’s subscribers come from the United States and Canada.
That means those two countries alone represented about 36% of the entire Netflix subscriber base.
At that time, the EMEA region (Europe, Middle East, Africa) was made up of almost 74 million subscribers, which made it the second region with the most subscribers.
Here is the full breakdown of Netflix subscribers by region:
| Region | Paying Subscribers 2022 | Paying Subscribers 2024 |
|---|---|---|
| UCAN (the United States & Canada) | 74.58 million | 89.63 million |
| EMEA (Europe, Middle East, Africa) | 73.73 million | 101.13 million |
| LATAM (Latin America) | 39.61 million | 53.33 million |
| APAC (Asia Pacific) | 33.72 million | 57.54 million |
Most Netflix subscribers are based in the EMEA region (Europe, Middle East, and Africa), accounting for more than 101 million of Netflix’s total global subscriber base.
Netflix Penetration Rate By Country
What about individual countries?
The penetration rate is one of the best measurements to see how successful Netflix has been in individual countries.
The penetration rate is the percentage of the relevant total population that has purchased a Netflix subscription at least once.
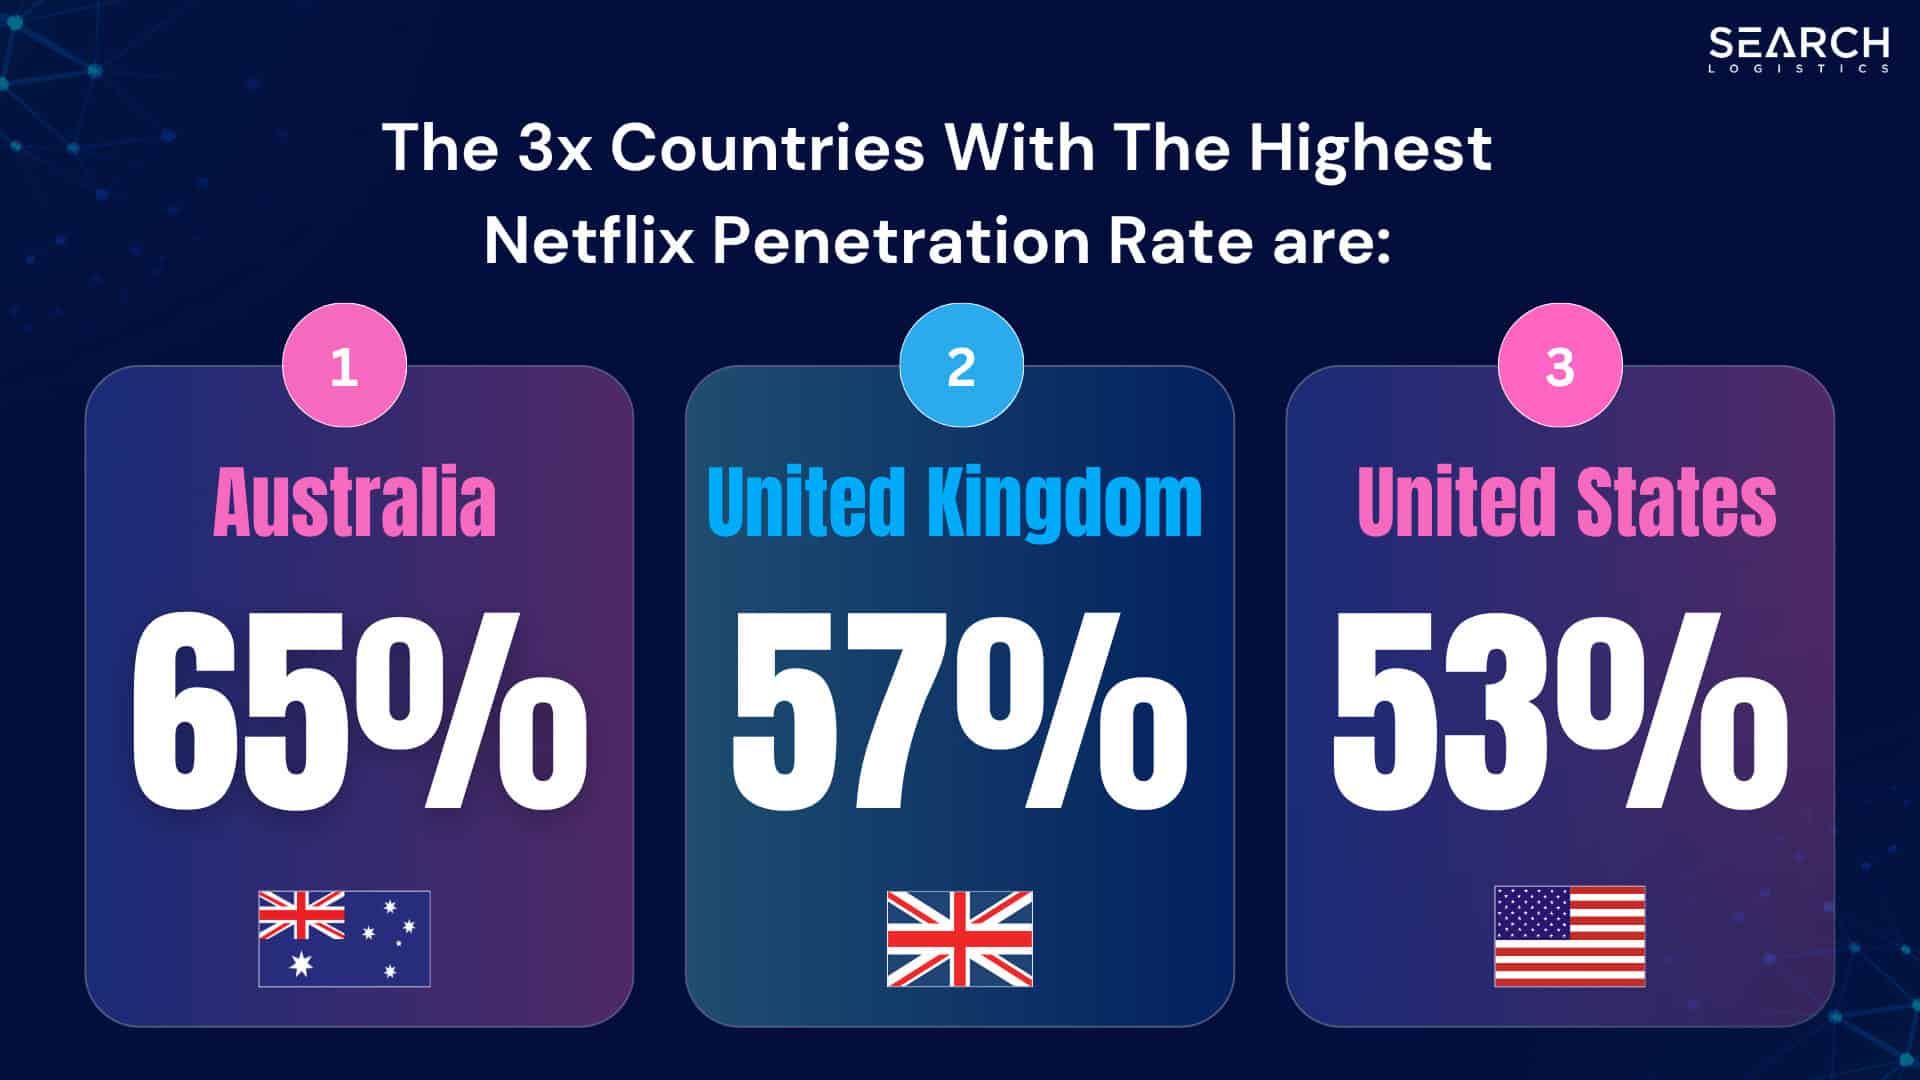
These are the top 10 countries for Netflix in terms of penetration rate:
| Country | Penetration Rate |
|---|---|
| Australia | 65% |
| United Kingdom | 57% |
| United States | 53% |
| Canada | 48% |
| France | 29% |
| Spain | 26% |
| Germany | 24% |
| Mexico | 23% |
| South Korea | 23% |
| Brazil | 22% |
Netflix has the highest penetration rate in Australia overall.
North America has the highest penetration rate in terms of region.
These countries generally have the bulk of subscribers and revenue for the platform. But it also shows that these countries are probably reaching market saturation.
Netflix’s goal is to retain subscribers in these countries rather than grow in them.
Time Spent On Netflix
There is no doubt that Netflix has a huge amount of paying subscribers.
But how much time do these subscribers actually spend using Netflix?
The results are staggering.
Time Spent Watching Netflix In The US
Netflix accounts for 25.7% of all daily video streaming among US adults.
In other words…
25.7% of all US adults consume streaming content daily is on Netflix.
And usage is on the rise. The number of minutes US adults spend daily on streaming Netflix has increased by a massive 57.89% since 2017.
Here’s the breakdown of the average Netflix daily usage among US adults since 2019:
| Year | Average Daily Time Per Subscriber (US) |
|---|---|
| 2019 | 53.3 minutes |
| 2020 | 59.6 minutes |
| 2021 | 60.5 minutes |
| 2022 | 61.3 minutes |
| 2023 | 61.8 minutes (Predicted) |
| 2024 | 62.1 minutes (Predicted) |
Time Spent Watching Netflix Globally
What about usage worldwide?
The average Netflix user spends 1 to 2 hours per day streaming content on Netflix. It takes users about 18 minutes to browse the platform to choose a show.
In 2009 the average global Netflix subscriber watched for an average of just 6 minutes!
Here’s the average total amount of time people spend on Netflix every day:
| Year | Average Daily Time Per Subscriber (Global) |
|---|---|
| 2009 | 6 minutes |
| 2010 | 24 minutes |
| 2011 | 48 minutes |
| 2012 | 1 hour 12 minutes |
| 2013 | 1 hour 24 minutes |
| 2014 | 1 hour 36 minutes |
| 2015 | 1 hour 48 minutes |
| 2019 | 2 hours |
| 2020 | 3 hours 12 minutes | 2025 | 1 – 2 hours |
Notice the big jump in 2020?
This was due to the COVID-19 pandemic. People spent much more time at home and therefore consumed more streaming content overall.
In fact, at the time, Netflix subscribers spent more than 3 hours a day on the platform, which accounted for 13% of their entire day. Everyday.
Now, things are back to normal, and it looks like people are spending about 1 to 2 hours a day on Netflix again.
Netflix User Demographics
Netflix has managed to appeal to users across different age groups and genders.
The company reported that its users are 51% women and 49% men.
| Gender | Percentage Of Users |
|---|---|
| Women | 51% |
| Men | 49% |
This is extremely balanced for any streaming platform.
What about age?
The bulk of Netflix’s subscribers is Gen-Z & millennials.
A massive 75% of respondents to a Statista survey aged between 18 – 34 said they had a Netflix subscription.

But that doesn’t mean older people aren’t older people don’t use the platform.
44% of people aged 65 years old had an active Netflix subscription.
Netflix Content Production Statistics
Netflix had over 2,000 originals at the beginning of 2021.
As of 2026, it’s estimated that Netflix has about 4,400 originals available.
In 2025, Netflix released 597 new originals, up from 2024’s 589 and 2023’s 568.
However, it was still considerably lower than in 2022, when 749 new Netflix Originals were added, possibly representing the peak.
Here is a table of Netflix originals released since 2022:
| Year | New Netflix Originals Released |
|---|---|
| 2022 | 749 |
| 2023 | 568 |
| 2024 | 589 |
| 2025 | 597 |
This can be a substantial competitive advantage – as long as the subscribers like what they produce.
So, how much does Netflix spend to produce those originals?
Netflix spent around $18 billion on content production in 2025.
Here is the full breakdown of how much Netflix has spent on video production each year since 2013.
| Year | Video Production Spendings |
|---|---|
| 2013 | $2.4 billion |
| 2014 | $3.18 billion |
| 2015 | $4.61 billion |
| 2016 | $6.88 billion |
| 2017 | $8.91 billion |
| 2018 | $12.04 billion |
| 2019 | $14.61 billion |
| 2020 | $17.3 billion |
| 2021 | $17 billion |
| 2022 | $17 billion (Estimated) |
| 2024 | $16.2 billion (Estimated) |
| 2025 | $18 billion (Estimated) |
Netflix’s content production spending grew by 35.68% from 2016 to 2020.
2021 was the first year that Netflix had a decline in video production. They spent about $300 million less than in 2020.
But in 2022, Netflix announced at its quarterly earnings presentation that they spent about $17 billion on video production, which makes sense since they released over 700 new originals that same year.
In 2025, their video production budget reached an all-time high, and it seems likely to continue growing in the years to come as they focus on producing originals.
Netflix vs The Competiton
It’s no secret that Netflix now has some serious competition:
- Disney+
- HBO Max
- Hulu
- Amazon Prime
- Apple TV+
There are tons of streaming platforms available to consumers offering lots of different content. And some of these new competitors are backed by massive multi-billion dollar companies.

The truth is that most of Netflix’s competitors just copied their model and used it as a blueprint.
But the reality is that it worked, and Netflix has struggled to maintain its subscriber value.
So the big question is can Netlfix continue to be the top dog?
Here are the latest Netflix statistics you need to know about their competition.
Netflix Is More Expensive Than Their Competitors
The truth is that Netflix is becoming more and more expensive.
The online streaming giant has constantly increased prices since 2011. When it first launched, it was just $7.99 per month.
The premium Netflix subscription, which offers 4 screens playing simultaneously (a common plan for families), is $24.99 per month.
Netflix has turned from “value for money” to a “premium” subscription for most users.
The big problem is that Netflix is far more expensive than top competitors:
| Network | Plan | Price |
|---|---|---|
| Disney+ | Disney+ Standard (with ads) Disney+ Prenium (no ads) |
$7.99/month $13.99/month |
| Apple TV+ | Only one plan available | $9.99/month |
| Hulu | Hulu (with ads) Hulu (no ads) |
$7.99/month $17.99/month |
| HBO Max | HBO Max (with ads) HBO Max (no ads) |
$9.99/month $15.99 |
| Amazon Prime Video | Only one plan available | $8.99/month |
It is true that the middle plan for Netflix is only $17.99 per month.
But that takes away 4k content and only allows you to stream on two simultaneous screens simultaneously.
The lowest level Netflix plan is just $7.99 per month but it has ads…
Netflix Doesn’t Have The Biggest Library
If we keep comparing Netflix to the same competitors, we notice that Netflix is not the streaming platform with the largest library.
In fact, Amazon Prime has the biggest library, by far.
Here is a breakdown of the streaming platforms’ library by size:
| Streaming Platform | Library Size (2025/2026) |
|---|---|
| Amazon Prime Video | 25,145 |
| Netflix | 7,865 |
| HBO Max | 3,574 |
| Hulu | 2,974 |
| Disney+ | 2,441 |
| Paramount+ | 1,550 |
| Apple TV+ | No Data |
However, Netflix is the platform with the most orginals, which is highly appreciated by their users.
Netflix Still Dominate The Market In Term Of Subscribers (For Now)
Despite being more expensive, Netflix is still at the top of the streaming market (for now at least).
The below table shows how many subscribers each major streaming platform has:
| Streaming Platform | Subscribers |
|---|---|
| Netflix | 325 million |
| Amazon Prime Video | 200 million |
| Disney+ | 150 million |
| HBO Max | 95 million |
| Paramount+ | 63.4 million |
| Hulu | 48 million |
| Apple TV+ | 25 million |
Amazon Prime statistics show that Prime Video is Netflix’s most significant competition in terms of subscribers.
But that may not be the case.
Prime Video is included in most Amazon Prime subscriptions. So by default, millions of people worldwide automatically get access to Prime Video.
This doesn’t necessarily mean they spend hours watching the platform or subscribe to Amazon Prime because of the video inclusions.
Looking directly at the following three competitors, Netflix has 4x as many paying subscribers.
The truth is that these competitors still have a long way to go to catch up to Netflix.

And remember, Netflix charges a higher price than all of these competitors.
That means they should have more money to spend on content production and development.
For now, Netflix is the clear winner in the online streaming industry.
Netflix Financial Statistics
How much money does Netflix actually make?
Netflix’s annual revenue was $29.69 billion in 2021. This was an 18.81% increase on 2020, where the annual revenue was $24.99 billion.
They also made $5.1 billion in net profit in 2021, which was a massive 85% increase on 2020.
As you can see, subscribers are just one side of the Netflix story.
Although Netflix subscriber rates dropped from quarter 4 of 2021 compared to quarter 1 of 2022 – revenue actually increased.
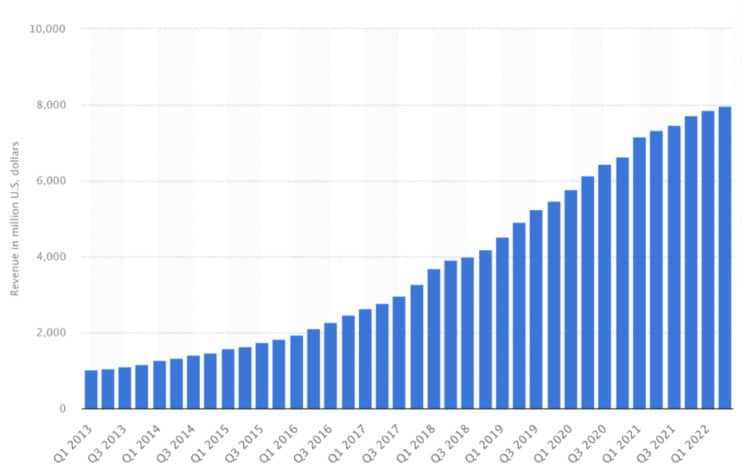
Netflix again managed to increase its earnings in quarter 2 of 2022, generating $7.97 billion in revenue.
This is despite losing another 1 million subscribers during the same time period.
In terms of earnings – Netflix is still crushing it!
Here is the breakdown of Netflix’s revenue earnings year over year since 2011:
| Year | Earnings (USD) |
|---|---|
| 2011 | $3.1 billion |
| 2012 | $3.5 billion |
| 2013 | $4.3 billion |
| 2014 | $5.4 billion |
| 2015 | $6.7 billion |
| 2016 | $8.8 billion |
| 2017 | $11.6 billion |
| 2018 | $15.7 billion |
| 2019 | $20.1 billion |
| 2020 | $25 billion |
| 2021 | $29.7 billion |
| 2022 | $31.62 billion |
| 2023 | $33.7 billion |
| 2024 | $39 billion |
| 2025 | $45 billion |
What regions are contributing the most revenue to Netflix?
Historically UCAN (the United States & Canada) has generated the most revenue for Netflix.
But as competition increases in this region, the EMEA (Europe, Middle East, Africa) region is quickly catching up.
Here is how much each region contributed to Netflix’s earnings:
| Region | Revenue Per Region |
|---|---|
| UCAN (the United States & Canada) | 12.97 billion |
| EMEA (Europe, Middle East, Africa) | 9.69 billion |
| LATAM (Latin America) | 3.57 billion |
| APAC (Asia Pacific) | 3.26 billion |
EMEA will become a more important part of Netflix over the next few years.
As of today, Netflix is estimated to be worth about $84.57 billion. That’s about 2.8x annual revenue.
Wrapping It Up
Back in 2022, Netflix faced a crisis that led to a subscriber decline.
But it seems that those days are behind them, since they now have more subscribers than ever before.
In the last few years, they invested massively in content production.
They are now releasing over 500 new originals every year.
The above statistics show that the online streaming industry is all about content. There isn’t a lot of brand loyalty to any of the platforms.
If you provide better content, you win.
And if you don’t, subscribers will go elsewhere.
It’s as simple as that.
Netflix has the experience and knows how to produce quality content people love. But whether they can continuously do it to justify their premium subscription will be the key to their future success.
Now I want to hear from you. What do you think about the future of Netflix?
Want more statistics posts? Take a look at these blogs:
You Might Also Like


What Are Your Thoughts?
4 Responses


Great insights! It’s fascinating to see how Netflix continues to adapt and grow despite increasing competition. I’m curious about how their investment in original content plays into their user retention strategies. Would love to see more data on viewer engagement!
Great insights! It’s fascinating to see how Netflix adapts to changing viewer preferences. I’m curious to know how their content strategy will evolve as competition increases.
Great insights! It’s interesting to see how Netflix is adapting to changes in subscriber trends. I’m curious about how their content strategy will evolve to attract new viewers while retaining existing ones. Thanks for sharing these stats!
with their increasing prices and the fact my hard earned cash was being GIVEN to a political party I cancelled my Netflix. I refuse to used as an indirect cash donator for a political party that I do not support. Clearly Netflix prices are too high if they can give my money away !